A lot can change in a year, and a lot did change in the comic book market during 2012. The year started off rough for Marvel with the top selling Marvel title in January 2012 selling below 64,000 units while DC had three series selling over 100,000 units. Thanks the Marvel NOW! initiative and "Amazing Spider-Man" #700, however, Marvel ended the year with multiple titles selling over 100,000 units.
The top selling comic of the year was "The Walking Dead" #100 with over 300,000 units. Most of the comics in the top 20 of the year end list were from Marvel, the majority of which were issues of "Avengers vs X-Men". From DC, "Batman" #13 and "Justice League" #12 both made it into the top 20, but then something interesting happens: Everything from rank 21 through 40 is an issue of "Batman" or "Justice League" except for the recent "Captain America" #1 at rank 39.
While DC Comics might not be placing as high on the list as in 2012, or getting sales over 170,000 units, its titles at the upper part of the title are ongoing, not miniseries. If DC can keep this up and get a few other titles consistently selling in similar numbers, they will have a huge sales advantage over Marvel. The estimated sales of 2,397,835 units for 13 issues of "Avengers vs X-Men" published in 2012 benefited Marvel in 2012. But the average sales on that title (approximately 184,449 units) will have zero carry over into 2013. Conversely, the 13 issues of "Batman" DC published in 2012 totaled to around 1,801,797 units, averaging around 138,600 units each. This average will change over the course of 2013, but it gives DC a strong title heading into the year. The sales of "Batman," "Justice League" and the other top selling titles for DC are there to be had or lost in 2013 depending on the ongoing quality and popularity of those titles. The sales for the top Marvel titles are, in most cases, gone since those titles have ended.
Sure, Marvel can potentially replace the sales on those titles with new titles. The key difference is DC has titles it can bank on now. New titles at DC add to the existing sales, while the Marvel NOW! titles are replacing existing sales. Of course, by the end of 2013 we could be looking at a very different situation. A change of creative teams could drastically alter how key DC titles perform, while some of the Marvel NOW! titles could settle in near the top of the month sales list. The initial sales data for the Marvel NOW! titles make it seem a little unlikely those titles will sell over 100,000 on a sustained basis like some of the DC titles have. But, frankly, I'm a bit surprised by both the sales level and longevity of those sales for titles like "Batman" and "Justice League."
The chart of both the units and dollars from month to month show a clear upward trend with a peak in May and a dip in September:

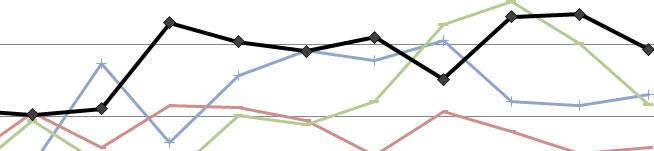
The peak in May reflects a strong month for both DC and Marvel, while the dip in September reflects an unusually weak month for Marvel, as illustrated by these charts which split the units and dollars by publisher.
The aggregate of all of the other publishers saw continued growth over the course of the year with July being a particularly good month for the other publishers. Many of the top talents at Marvel and DC started out at smaller publishers, and seeing steady growth in these other publishers is a great sign for the industry. These titles can be risky for retailers to carry, but can also bring in a readership not served by the mainstream Marvel and DC offering.
While the month to month picture looks fairly good during 2012, the picture of the advances and declines paints a less favorable picture:
The fact that titles drop in sales as they age is nothing new. This standard attrition is why publishers, Marvel in particular, tend to restart titles so often. This initial bump in sales is short lived, but the resulting infusion of sales seems to be increasingly needed.
In 2011, the New 52 reboot at DC skewed the numbers significantly. The Marvel NOW! initiative was spread across a number of months, however, and didn't skew the numbers as sharply in any particular month. The net gain of around 30,000 units in May is a very positive sign for the industry. It may not seem like much -- it equates to the sales of a single issue and isn't a massive net gain. What makes it special is it is the first time gains have outpaced declines within a given month since Diamond first started reporting sales to retailers in March, 2003. The gains on the various Batman titles during the "Night of the Owls" crossover in May are an obvious explanation for the strong month for DC and the net gain in sales for ongoing titles. This shows sales for ongoing titles can go up in aggregate, proving there is an option to a constant restarting and shuffling of titles.
Overall, 2012 was a good year according to the top comics lists. While not as good as 2006 to 2008, 2012 was a stronger year than most of the last decade.
The rolling 12 month average has been picking up steam over the last year, coinciding with the New 52 from DC. DC continues to have a number of very strong selling titles, and Marvel NOW! gives Marvel the chance for similar success. Meanwhile, the other publishers are gaining strength, giving readers a number of alternatives to the superhero-dominated output of Marvel and DC.
This year is starting off on much better footing than 2012 did, and hopefully we will see strong and robust sales across the industry during the course of 2013.
As always, if you have any questions or comments, please feel free to email me at John.Mayo@ComicBookResources.com.
TOP COMICS
January, 2012
DC sold a combined total of 2,465,425 units across 84 items for a total of $7,714,760.75
Marvel sold a combined total of 2,265,059 units across 80 items for a total of $8,322,383.57
The top comics list sold a combined total of 5,783,081 units across the 300 items on the list for a total value of $19,826,356.42 at cover price.
February, 2012
DC sold a combined total of 2,366,863 units across 85 items for a total of $7,411,191.37
Marvel sold a combined total of 2,463,563 units across 81 items for a total of $8,910,521.01
The top comics list sold a combined total of 6,086,689 units across the 300 items on the list for a total value of $20,977,119.45 at cover price.
March, 2012
DC sold a combined total of 2,354,096 units across 93 items for a total of $7,395,431.04
Marvel sold a combined total of 2,509,627 units across 74 items for a total of $9,223,419.01
The top comics list sold a combined total of 6,017,819 units across the 300 items on the list for a total value of $20,799,022.62 at cover price.
April, 2012
DC sold a combined total of 2,203,727 units across 81 items for a total of $7,123,135.73
Marvel sold a combined total of 2,559,949 units across 76 items for a total of $9,391,023.47
The top comics list sold a combined total of 6,102,089 units across the 300 items on the list for a total value of $21,342,329.38 at cover price.
May, 2012
DC sold a combined total of 2,842,754 units across 78 items for a total of $9,566,391.46
Marvel sold a combined total of 3,059,829 units across 94 items for a total of $11,180,450.71
The top comics list sold a combined total of 7,295,088 units across the 300 items on the list for a total value of $25,723,213.56 at cover price.
June, 2012
DC sold a combined total of 2,804,383 units across 85 items for a total of $9,350,935.17
Marvel sold a combined total of 2,884,582 units across 80 items for a total of $10,682,538.18
The top comics list sold a combined total of 7,033,386 units across the 300 items on the list for a total value of $24,914,761.25 at cover price.
July, 2012
DC sold a combined total of 2,533,159 units across 81 items for a total of $8,367,982.41
Marvel sold a combined total of 2,648,278 units across 74 items for a total of $9,847,892.70
The top comics list sold a combined total of 6,898,914 units across the 300 items on the list for a total value of $24,904,402.77 at cover price.
August, 2012
DC sold a combined total of 2,795,311 units across 85 items for a total of $9,669,571.89
Marvel sold a combined total of 2,940,597 units across 84 items for a total of $10,875,613.91
The top comics list sold a combined total of 7,099,282 units across the 300 items on the list for a total value of $25,526,588.54 at cover price.
September, 2012
DC sold a combined total of 2,808,966 units across 82 items for a total of $9,270,690.34
Marvel sold a combined total of 2,338,770 units across 77 items for a total of $8,440,740.30
The top comics list sold a combined total of 6,511,956 units across the 300 items on the list for a total value of $22,800,895.43 at cover price.
October, 2012
DC sold a combined total of 2,694,819 units across 85 items for a total of $9,223,924.81
Marvel sold a combined total of 3,281,761 units across 80 items for a total of $12,650,042.39
The top comics list sold a combined total of 7,381,572 units across the 300 items on the list for a total value of $27,032,463.66 at cover price.
November, 2012
DC sold a combined total of 2,578,703 units across 81 items for a total of $8,567,003.97
Marvel sold a combined total of 3,221,671 units across 68 items for a total of $11,983,949.29
The top comics list sold a combined total of 7,415,676 units across the 300 items on the list for a total value of $26,375,300.18 at cover price.
December, 2012
DC sold a combined total of 2,656,084 units across 82 items for a total of $8,823,159.16
Marvel sold a combined total of 2,733,125 units across 63 items for a total of $10,655,311.75
The top comics list sold a combined total of 6,932,703 units across the 300 items on the list for a total value of $24,809,419.47 at cover price.
TOP TRADES
January, 2012
DC sold a combined total of 74,196 units across 67 items for a total value of $1,675,034.48 at cover price.
Marvel sold a combined total of 80,834 units across 88 items for a total of $2,134,168.00 at cover price.
The top trades list sold a combined total of 277,559 units across the 300 items on the list for a total value of $5,974,149.31 at cover price.
February, 2012
DC sold a combined total of 65,766 units across 65 items for a total value of $1,291,648.34 at cover price.
Marvel sold a combined total of 80,733 units across 77 items for a total of $2,127,924.26 at cover price.
The top trades list sold a combined total of 270,031 units across the 300 items on the list for a total value of $5,723,314.69 at cover price.
March, 2012
DC sold a combined total of 67,493 units across 53 items for a total value of $1,303,304.07 at cover price.
Marvel sold a combined total of 118,634 units across 132 items for a total of $2,904,380.66 at cover price.
The top trades list sold a combined total of 318,453 units across the 300 items on the list for a total value of $6,435,519.33 at cover price.
April, 2012
DC sold a combined total of 70,723 units across 65 items for a total value of $1,701,949.56 at cover price.
Marvel sold a combined total of 73,844 units across 71 items for a total of $1,878,763.96 at cover price.
The top trades list sold a combined total of 330,041 units across the 300 items on the list for a total value of $6,760,328.68 at cover price.
May, 2012
DC sold a combined total of 122,972 units across 72 items for a total value of $2,860,612.28 at cover price.
Marvel sold a combined total of 91,108 units across 73 items for a total of $2,332,678.48 at cover price.
The top trades list sold a combined total of 385,666 units across the 300 items on the list for a total value of $8,271,117.09 at cover price.
June, 2012
DC sold a combined total of 91,172 units across 71 items for a total value of $2,236,132.88 at cover price.
Marvel sold a combined total of 72,949 units across 63 items for a total of $1,692,453.51 at cover price.
The top trades list sold a combined total of 364,903 units across the 300 items on the list for a total value of $7,456,115.16 at cover price.
July, 2012
DC sold a combined total of 131,001 units across 80 items for a total value of $2,676,388.52 at cover price.
Marvel sold a combined total of 62,837 units across 63 items for a total of $1,629,765.63 at cover price.
The top trades list sold a combined total of 351,688 units across the 300 items on the list for a total value of $7,126,391.67 at cover price.
August, 2012
DC sold a combined total of 122,644 units across 100 items for a total value of $2,851,223.78 at cover price.
Marvel sold a combined total of 74,192 units across 64 items for a total of $1,880,499.46 at cover price.
The top trades list sold a combined total of 355,890 units across the 300 items on the list for a total value of $7,706,317.05 at cover price.
September, 2012
DC sold a combined total of 114,022 units across 112 items for a total value of $2,677,516.63 at cover price.
Marvel sold a combined total of 98,676 units across 78 items for a total of $2,108,839.32 at cover price.
The top trades list sold a combined total of 345,010 units across the 300 items on the list for a total value of $7,145,851.44 at cover price.
October, 2012
DC sold a combined total of 143,816 units across 96 items for a total value of $3,060,476.84 at cover price.
Marvel sold a combined total of 80,660 units across 60 items for a total of $1,962,238.86 at cover price.
The top trades list sold a combined total of 401,850 units across the 300 items on the list for a total value of $8,613,919.34 at cover price.
November, 2012
DC sold a combined total of 90,524 units across 68 items for a total value of $2,079,891.86 at cover price.
Marvel sold a combined total of 51,748 units across 42 items for a total of $1,473,959.87 at cover price.
The top trades list sold a combined total of 350,454 units across the 300 items on the list for a total value of $7,062,029.48 at cover price.
December, 2012
DC sold a combined total of 53,324 units across 60 items for a total value of $1,230,221.39 at cover price.
Marvel sold a combined total of 64,644 units across 50 items for a total of $1,424,746.09 at cover price.
The top trades list sold a combined total of 310,072 units across the 300 items on the list for a total value of $6,290,264.03 at cover price.