January 2017 had 7,0208,684 units in the top 300 comics list, a drop of 356,926 units from last month. Marvel placed 2,928,457 units on the top 300 comics list accounting for 41.66% of the units. DC had 2,904,117 units on the list accounting for another 41.32% of the total units for the top 300 comics. The gap of 24,340 units between Marvel and DC is the smallest gap seen during the final order era which began in early 2003 when Diamond switched from reporting pre-orders to what was actually shipped and invoiced to stores. The other premiere publishers, Image, IDW and Dark Horse, accounted for another 11.49% of the unit sales with a combined total of 807,415 units. The remaining 5.53% of the units was split across 19 other publishers which had a combined total of 388,695 units.
RELATED: January Comic Sales Dip, Still the Strongest Start to a Year on Record
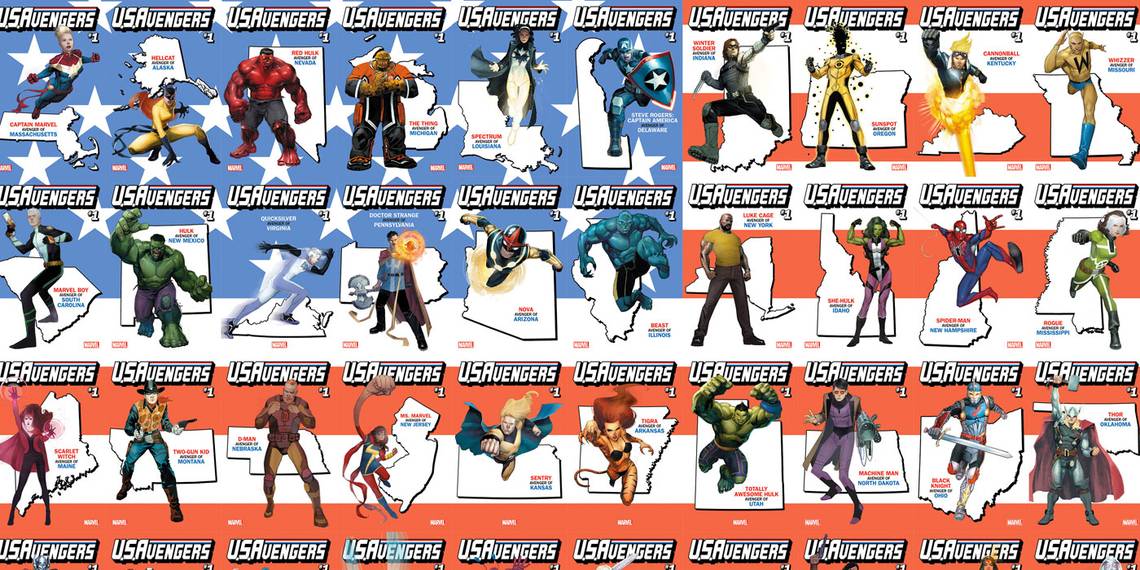
"US Avengers" #1 topped the list with 110,729 units, selling only 3,913 more units than the 106,816 units sold by "Batman" #14. "US Avengers" #1 had around sixty different covers. The majority of the covers assigned an Avenger to a particular state and required retailers to meet or exceed 200% of their orders for "Uncanny Avengers" #13 to be eligible to order as many of any of the state covers as they wanted. "Uncanny Avengers" #13 sold 37,908 units in August 2016. "Uncanny Avengers" #1 sold 105,234 units in October 2015. I don't know how Marvel initially expected "US Avengers" #1 to sell with the heavy promotional push they gave it with those covers. Personally, I thought the first issue has the potential to sell over 250,000 units with the cover gimmick. "Justice League of America" #1 sold 307,734 in February 2013 with a simpler version of the cover gimmick. The only difference on those state covers was the state flag on top of the same art while the the only common element of the "US Avengers" #1 covers was the title logo and issue number. The "US Avengers" also had an interlocking American flag background. From a creative perspective, the "US Avengers" state cover gimmick was more impressive than the "Justice League of America" #1 state covers. From a sales perspective, there is a 197,005 unit difference in the Justice League's favor.
Even without the state covers, a high profile Marvel relaunch like "US Avengers" might have been able to crack 100,000 on the first issue, but probably would not have done so. The lack of a huge bump in sales from the state cover promotion put into question the sales power of variant covers. It is also possible retailers were stuck with unsold copies of the "Justice League of America" #1 state covers and therefore ordered much more conservatively on the "US Avengers" #1 state covers.
Marvel had some very high launch numbers on a few titles in 2016 like the 381,737 units on "Civil War II" #1, the 328,165 units on "Champions" #1 and the 253,259 units on "Black Panther" #1. But those seem to be the exception with recent history showing Marvel having average sales ongoing title first issues around 77,512 units. These days I find it challenging to tell which Marvel titles are intended to be a miniseries versus an ongoing title. The definition I used of a miniseries is a title launched with a known ending issue number. If the solicitation of the second issue is the first time an ending issue number is mentioned, I treat it as an ongoing title. Feel free to use whatever definition works for you and calculate the average first issue sales of Marvel ongoing titles using it. Most reasonable definitions of the term "ongoing series" will probably yield an average first issue sales around the 60,000 to 85,000 units or less. Even relaunches of core titles like "Avengers" #1 sold around 81,885 units, failing to crack the 100,000 unit mark by a noticeable margin. Cover gimmicks used to be a reliable way to inflate first issue sales to make the new title look like a hit right out the gate. That may not be true any more. This put into question the sales power of first issues.
If first issues are no longer strong sellers then Marvel's strategy of routinely relaunching titles might not work out well. Rotating titles in and out provides jumping-off points as well as jumping-on points. This is one of the key differences in strategy between Marvel and DC right now. Marvel is going with an ambiguously defined seasonal model with new titles on a roughly yearly basis. DC, on the other hand, seems to favor titles which last for multiple years. Constantly ending and restarting titles seems like it is essentially is training retailers and readers to jump from title to title and to only check out titles when they first launch. Longer lasting ongoing titles like DC has seem to leverage the habitual buying patterns of readers and to encourage readers to try out titles in the middle of a run and not only at the beginning of a series. Neither strategy is inherently better than the other but they can lead to very different reader behavior. For Marvel and DC which have large shared universes, getting readers engaged in those universe and keeping them engaged over time seems like the best strategy. For publishers like Image which have numerous titles set in distinct narrative universes, getting readers used to checking out new titles on a regular basis is a sound strategy.

Marvel and DC had roughly the same number of units in the top 300 in January which makes it look like the strategies the two companies are using are working about equally well. Marvel's over-shipping clouds the issues a bit. Even with the over-shipping by Marvel, 206,783 units of the 356,926 units lost in the top 300 between December and January came from Marvel titles which equates to nearly 58% of the decline in sales. Marvel also is publishing more titles than any other publisher and sales tend to go down so Marvel having the largest portion of the losses is practically guaranteed based on that alone.
It was a good month for the Justice League with 7 of the top 15 items in the top 300 comics being Justice League comics of one sort or another.

The first bar chart is the unit sales by category. The second is the month-to-month change in sales for the categories with the largest segments closest to the zero point on the y axis in either direction. The third chart is the net change in sales from last month.
I made a couple of changes to these title status charts this month. First, I changed up the color scheme on the title status charts in an attempt to make the bar charts more readable. If someone has suggestions on a better color scheme, please let me know. I also split the Continuing Titles group down further into five sub-groups:
"Continuing Titles (Gained Sales)" are titles which gained sales over the previous month without shipping more issues.
"Continuing Titles (More Issues)" are titles which shipped more issues this month as compared to last month. Sometimes these titles sell more units as a result, sometimes they don't.
"Continuing Titles (Stable Sales)" are titles which sold either as much as last month or less than 250 unit fewer than last month with the same number of issues released. Very few titles fall into this category. Since most titles don't increase in sales, I decided to consider any increase in sales, even a single unit, to be in the "Continuing Titles (Gained Sales)" category. This is a charitable definition of stable sales and I'm open to suggestions on a better working definition of stable sales. For now, this is what I'm using.
"Continuing Titles (Fewer Issues)" are titles which shipped fewer issues this month than last month. Usually this results in lower monthly sales for the title but not always.
"Continuing Titles (Lost Sales)" are titles which shipped the same number of units as last month but declined in sales.
The colors on the horizontal charts below indicate the publishers using the same colors as the publisher breakdown chart above.

Around 1,053,678 units came from titles which increased in sales over last month. Virtually all of the titles which gained in sales were Marvel titles but with Marvel's overshipping it is hard to tell how what percentage of the units are purchased and what percentage was overshipped for free. As a result, this category is of questionable use this month for gauging if these titles are actually increasing in sales with retailers or readers.

Around 862,567 units came from titles which shipped more issues this month as compared to last month. The weekly "Justice League/Suicide Squad" miniseries concluded moving a total of 287,451 units across the four issues in January. Those 287,451 will be in the defunct titles category next month and we'll see if DC can compensate for that loss.
Continuing titles with reasonably stables sales, drops of 250 units or less, accounted for 157,587 units. Since I'm putting titles with any increase in sales, even a single unit, into the "Continuing Titles (Gained Sales)" category, this category of titles with stable sales includes any title which lost 250 units or less. This is admittedly an arbitrary criteria but I felt the category was worth having. This entire category totals to a net loss of only 2,544 units which is in the ballpark of the number of retail stores.
"The Walking Dead" #162 sold 85,395 units and was the fifth best selling comic of the month. It got into the top five by having some small dips in sales and a lot of increase in sales.

Continuing titles which shipped fewer issues this month than last contributed 156,281 units.
"Star Wars: Doctor Aphra" #3 sold 48,592 units, down 20.88% from the second issue and is roughly half the sales of the first issue. The first two issues both came out in December and only a single issue was released in January. This title replaced the "Darth Vader" series.

While it is still early, it looks like removing Darth Vader from the series and continuing it under the name of an character unknown to all but the readers of the "Darth Vader" series is resulting in lower sales as one might expect. Promotion a supporting character to the lead character while removing one of the most iconic Star Wars characters from the series as part of the rotation of titles is a fairly drastic move. We'll see over time if the series levels out or not.

About half the total unit sales for the top 300 comics, approximately 3,481,010 units, in January came from continuing titles which lost sales. The chart for this category only included titles which lost more than 5,000 units. The top portion of this category is recently launched Marvel titles.

"Batman" has fallen back to the level the New 52 volume ended at. The sales trend on "Batman" bounces around a lot over time. A new creative team or major new storyline can cause a bump in sales for a while. The upcoming storyline of "The Button" which picks up a plot thread from "DC Universe Rebirth" will likely cause another such upswing in sales on "Batman" and "Flash."

Approximately 875,004 units came from new titles this month.
"US Avengers" #1 topped the list with 110,729 units but "US Avengers" #2 dropped 73.34% from the first issue selling only 29,523 units. That is roughly the sales level of the final arc of the "New Avengers" series this title replaced.
"Justice League/Power Rangers" #1 launched strong with 86,589 units out selling each of the four issues of "Justice League/Suicide Squad" released in January.
The various "Justice League of America: Rebirth" one-shots all sold around 27,000 to 30,000 units implying the new "Justice League of America" series could end up in that sales range after the initial few issues are released.
The "Kamandi Challenge" launches with 23,576 units and presumably DC is committed to publishing all of the remaining eleven issues of the series even if sales decline. Hopefully it will sell well enough DC won't have to make that decision. After "Vigilante: Southland" #3 marked the abrupt end of that miniseries halfway through the expected run, and "Kamandi Challenge: launching with under 24,000 units, it doesn't seem unreasonable to question if all twelve issues of this series will be published as single issue.
Titan Comics continues doing comic book seasons of Doctor Who with the Tenth Doctor and Eleventh Doctor both starting a third year of comics. These volume last about a year and roughly analogous to a television season of the show. Both title launched higher than the previous volumes ended.

Titles returning to the top 300 list this month accounted for around 280,494 units. All of the titles which didn't ship in December and returned to the top 300 list in January sold under 30,000 units with the 26,261 units from "Doom Patrol" #4 topping this category.

Titles accounting for around 593,455 units in December didn't ship in January. Some of them are bimonthly titles while others are running late. The 119,114 units for "Dark Knight III: The Master Race" accounts for about 20% of the units lost from the various titles which didn't ship in January. "Vigilante: Southland" is in this category because there were three other issues originally expected to ship. Since these three issues were canceled with the February round of solicitations, this title should be in the defunct titles category.
Marvel only had a single title in this category, "Silver Surfer." Even with the fast release schedule for many Marvel titles, they are able to get the titles out each month.

Defunct titles removed 320,303 units which were in the top 300 comics last month. "Civil War II" ended last month resulting in a loss of 105,658 units of sales which could have carried over from month to month for Marvel.

Annuals and specials accounted for 108,725 units which is 1,989 units less than last month. Most of the sales this month were from "Monster Unleashed" tie in issues.
Negative numbers on the reorder category chart represent titles which had more reorder activity last month than this month. Reorder activity accounted for only 53,338 units in January including the 43,837 units for "Saga" #41. "Saga #41 shipped in December but was misprinted. Retailers were instructed to destroy the copies they got in December and this reorder activity is the replacement copies. "Saga" #41 sold 43,628 units in December which means there were 209 additional units this month. Presumably this is why the entry has a retail ranking of 548.
The losses of 1,874,332 units was more than the gains of 1,517,406 units in January resulting in a net loss of 356,936 units from last month. Typically January is a weak month but this was the strongest January for the top 300 comics during the final order era which began in early 2003. With 2017 off to a stronger start than past years, hopefully the publishers can turn things around from the month-to-month decline in sales we've seen over the past few months.
For a more in-depth discussion of the sales data, check out the Mayo Report episodes of the Comic Book Page podcast at www.ComicBookPage.com. The episode archived cover the past decade of comic book sales on a monthly basis with yearly recap episodes. In addition to those episodes on the sales data, every Monday is a Weekly Comics Spotlight episode featuring a comic by DC, a comic by Marvel and a comic by some other publisher. I read around 200 new comics a month so the podcast covers a wide variety of the comics currently published. If you are looking for more or different comics to read, check out the latest Previews Spotlight episode featuring clips from various comic book fans talking about the comics they love. With thousands of comics in Previews every month, Previews Spotlight episodes are a great way to find out about new comic book titles that may have flown under your comic book radar.
As always, if you have any questions or comments, please feel free to email me at John.Mayo@ComicBookResources.com.