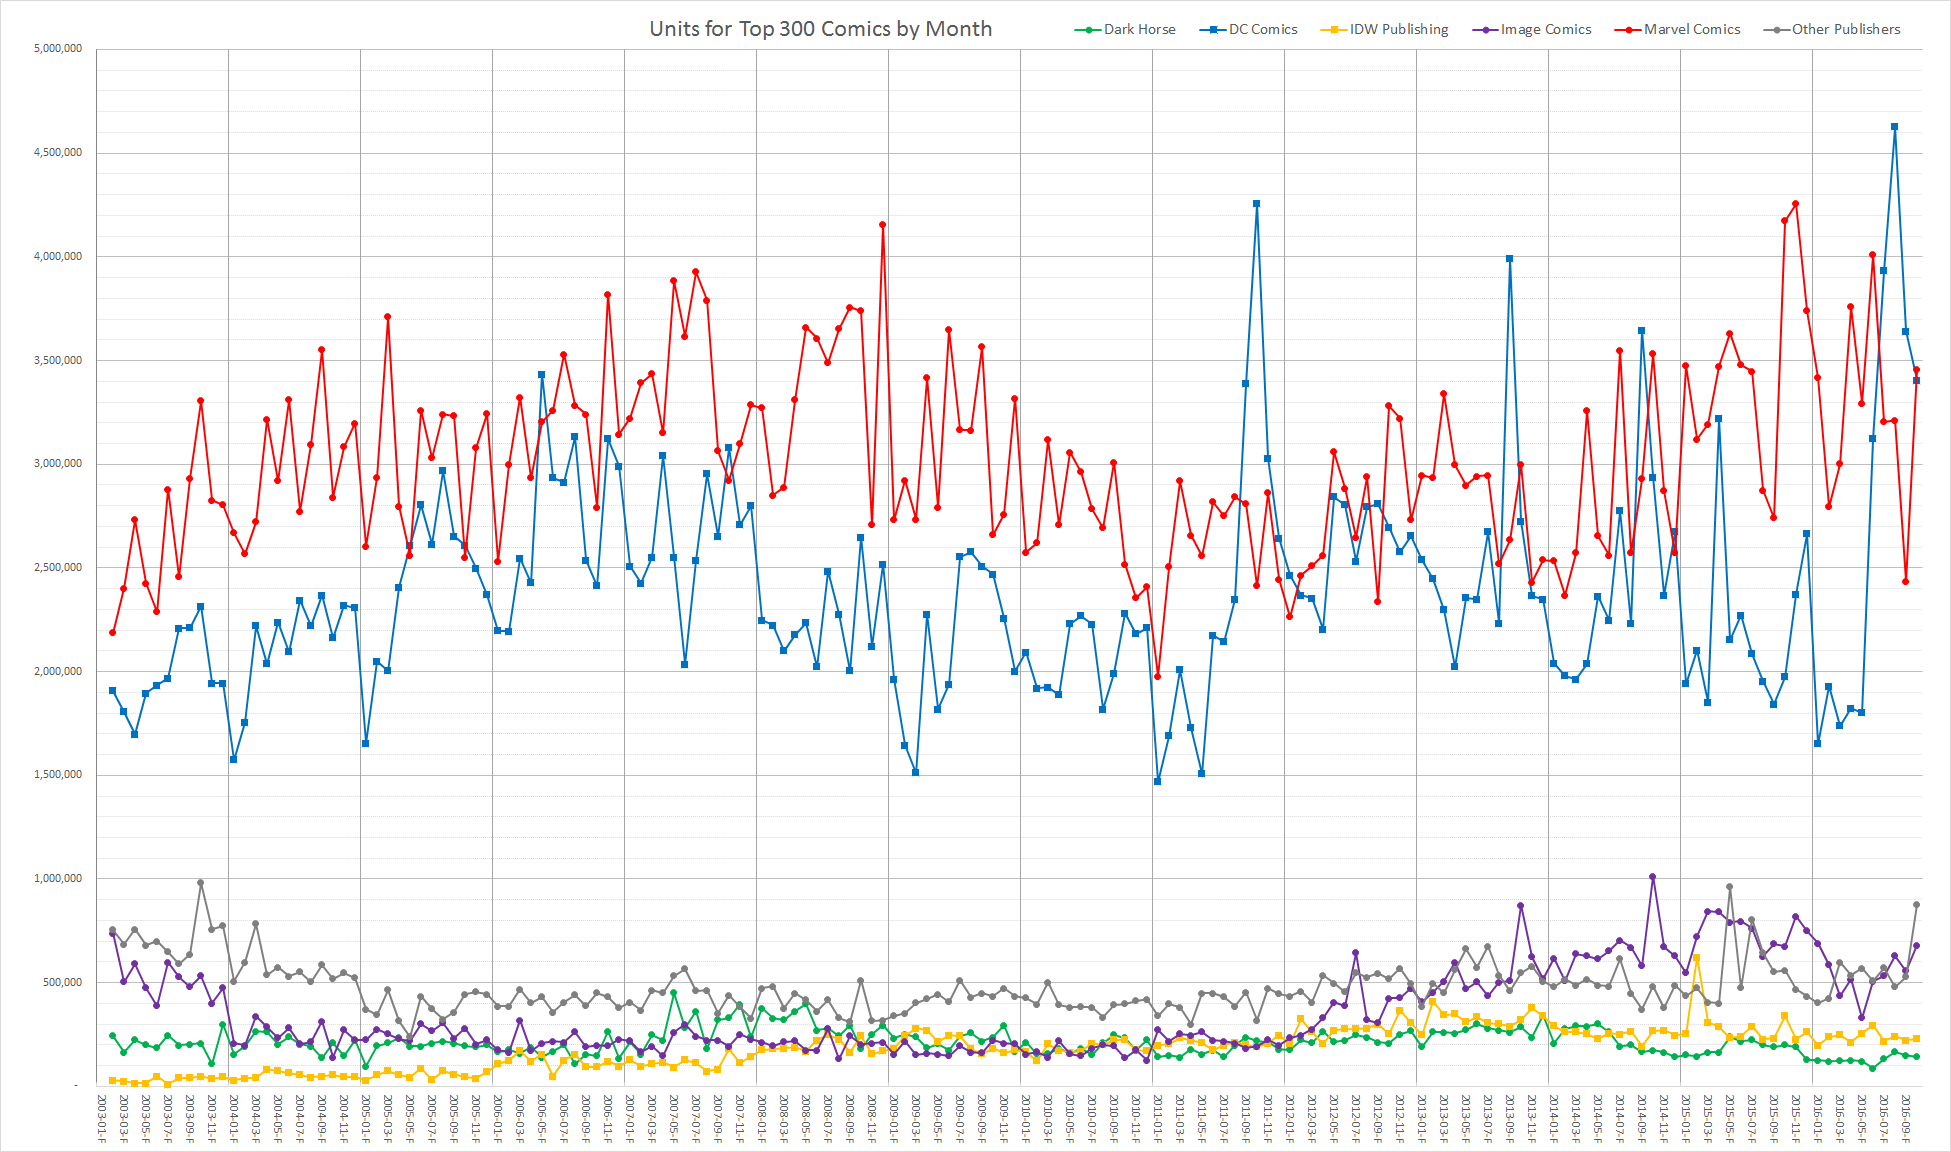
October 2016 had 8,793,717 units in the top 300 comics list, the second most units since Diamond first started reporting invoiced sales near the start of 2003. Marvel took the lead again in October with the narrowest margin we've seen of just 0.59% between the 39.32% of the units for the top 300 comics for Marvel and the 38.73% for DC. That difference of 52,223 units is the equivalent of an item between ranks 46 and 47. Image accounted for 7.74% of the units and BOOM! Studios displaced IDW Publishing in October as the fourth place publisher with 5.79% of the units compared to the 2.62% for IDW Publishing.
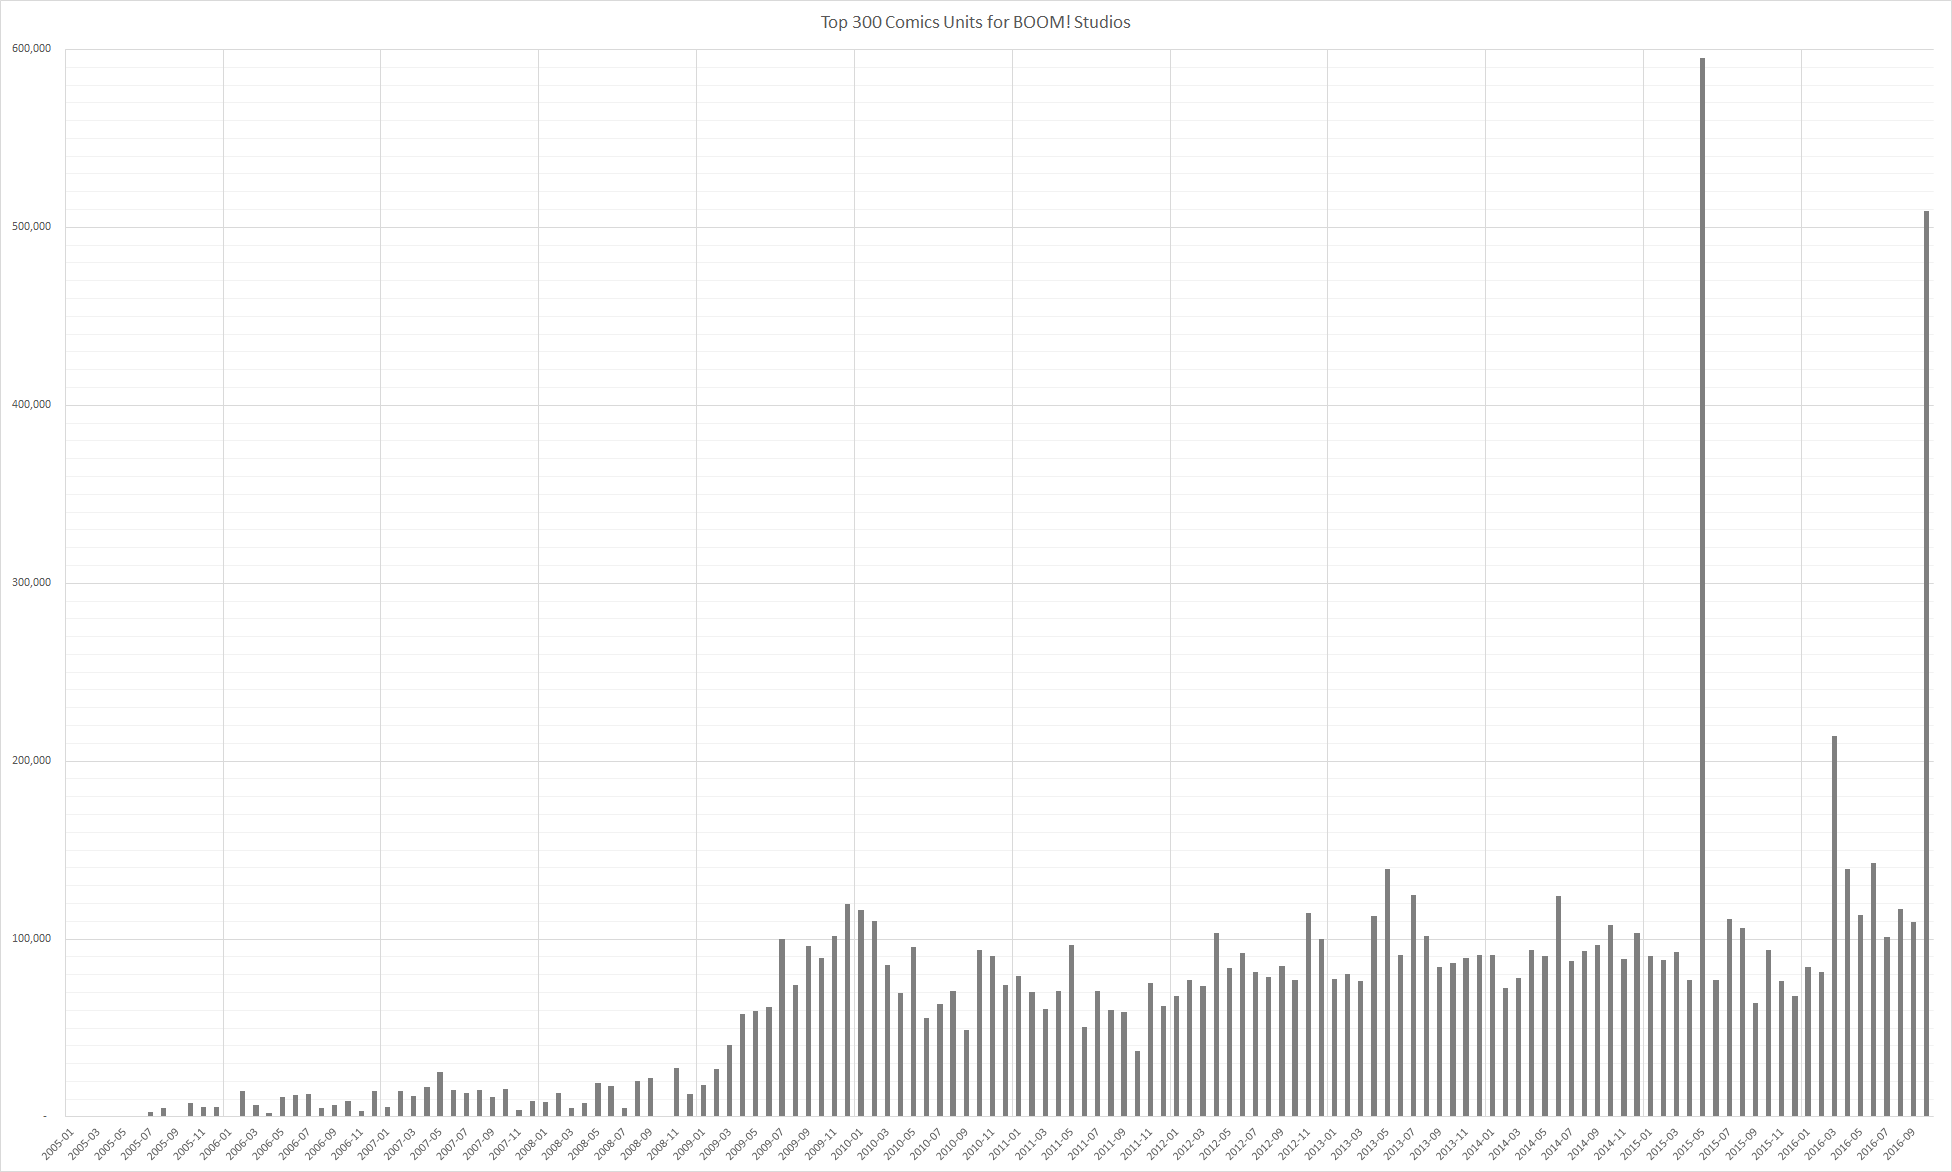
This is the closest split between Marvel and DC in the top 300 comics that we've ever seen. DC was down 235,835 units while Marvel was up by 1,022,085 units. BOOM! Studios was up 399,072 due to the launches of "Big Trouble in Little China/Escape From New York" and "Warlords of Appalachia" offsetting the declines on the continuing titles. "Skybourne" #2 sold 11,977 units to retailers, down 45.87% from 22,125 units on the first issue. This was an unusually good month for BOOM! Studios. The only other time BOOM! Studios has done this well was when "Orphan Black" #1 was included in subscription boxes. "Big Trouble in Little China/Escape From New York" #1, a variant cover edition of which was available as a Loot Crate exclusive, accounts for a little over 81% of the units in the top 300 comics for BOOM! Studios. BOOM! Studios had 109,858 units in the top 300 comics in September 2016 and averages around 71,620 units.
RELATED: Marvel #1 Publisher in October 2016, but BOOM! Had the Best-Selling Comic
With more and more titles shipping multiple issues per month and the major shifts in sales that we've seen from month to month in the past few months, it is time for a closer look at the different groups of titles which make up the top 300 comics list each month. This perspective on the monthly top 300 comics list is still a bit of work-in-progress and will evolve over time. I'm currently grouping the titles into six major categories: Annuals/Specials, Continuing Titles, New Titles, Reorders, Suspended Titles, Defunct Titles and Returning Titles.
Annuals/Specials are the annuals and specials which are part of a title but aren't a regular issue of the series. This category can increase or decrease the total units for the top 300 comics list depending on the number of annuals and specials that shipped in the current and previous month.
Continuing Titles are continuing volumes of titles which were on the top comics list last month and are on it again this month. In theory, if sales were stable, this is the group of titles which would form the bedrock of the sales from month to month. This category is both the core of the unit sales in most months and is generally a decrease the total units for the top 300 comics list from month to month. The unfortunate reality is Continuing Titles tend to have a standard attrition of a few percent per issue. With more frequent releases we might see the standard attrition decrease on an issue to issue basis but probably not on a month to month basis. There is nothing magical or inevitable about this standard attrition. It is nothing more than a measure of past sales trends.
New Titles are new titles or new volumes of existing titles. In many cases, these are simply replacing a recently concluded title and aren't as new as the category name might seem to imply. Since there are not previous sales to compare against, New Titles represent an increase in sales each month. Since this category can only represent an increase in sales, the category has the same number of units on both the sales and delta charts below.
Reorders are items which have placed on the list in a past month and have managed to get enough additional sales for an issue to get onto the top 300 comics again. Reorders can increase or decrease the total units for the top 300 comics list depending on the number reorders in the current and previous month.
Not all titles ship every month. Titles which don't ship in a given month fall into two distinct categories: titles which didn't ship that month but will ship in the future and titles which ended with the issue shipped in the previous month.
Suspended Titles are the titles which didn't ship this month but are expected to ship in the future.
Defunct Titles are ones believed to have ended with the previously shipped issue. Defunct Titles represent a presumably permanent decrease in month to month sales with the caveat that these titles might get continued as some point in the future such as "Action Comics" and "Detective Comics" which as both continuations of titles thought to be defunct as of the launch of the New 52 replacement volumes in 2011. Any title with no future issues solicited is considered to be Defunct and as a result, while most of these titles have ended, some may just have awkward gaps in the release schedule.
Returning Titles are titles which were in the Suspended Titles or Defunct Titles and shipped in the current month. Suspended Titles represent a decrease in sales from month to month but not sales drops for the titles since sales can't be considered lost until the next issue ships with lower sales. Regardless, retailers can't sell comics which haven't shipped. For instance, "Spider-Man" #9 should have shipped on October 26th, 2016 and didn't. (It is currently expected to ship on November 16th, 2016, three weeks after the originally expected shipped date.) Whether it sells more or less than the 44,744 units "Spider-Man" #8 which sold in September, the total for the top 300 comics in October doesn't have any sales for "Spider-Man." The title was effectively suspended for the month. Provided "Spider-Man #9 ships in November, the total for the top 300 comics in November will have sales for "Spider-Man" while October didn't putting the title into the Returning Titles category in November. If, however, the issue doesn't ship in November (and there is no reason to think it won't), neither the October nor November totals for the top 300 comics would include "Spider-Man" resulting in the total having no impact on the month-to-month sales change between October and November. The title would effectively be in suspense until it ships again. Returning Titles represent an increase in month to month sales and therefore has the same number of units on both the sales and delta charts below.
Defunct Titles, Suspended Titles and Returning Titles categories aren't all that complicated. We just need a mechanism for tracking the sales that leave the top 300 comics because of the now constant rotation of titles over time.
In addition to not shipping in a given month, a title can drop below the radar of the top 300 comics list and later get back on the list either by the title increasing in sales or by the list including lower selling titles. This usually doesn't represent enough units to be worth breaking out into distinct categories so these titles are currently included in the Suspended Titles and Returning Titles categories.
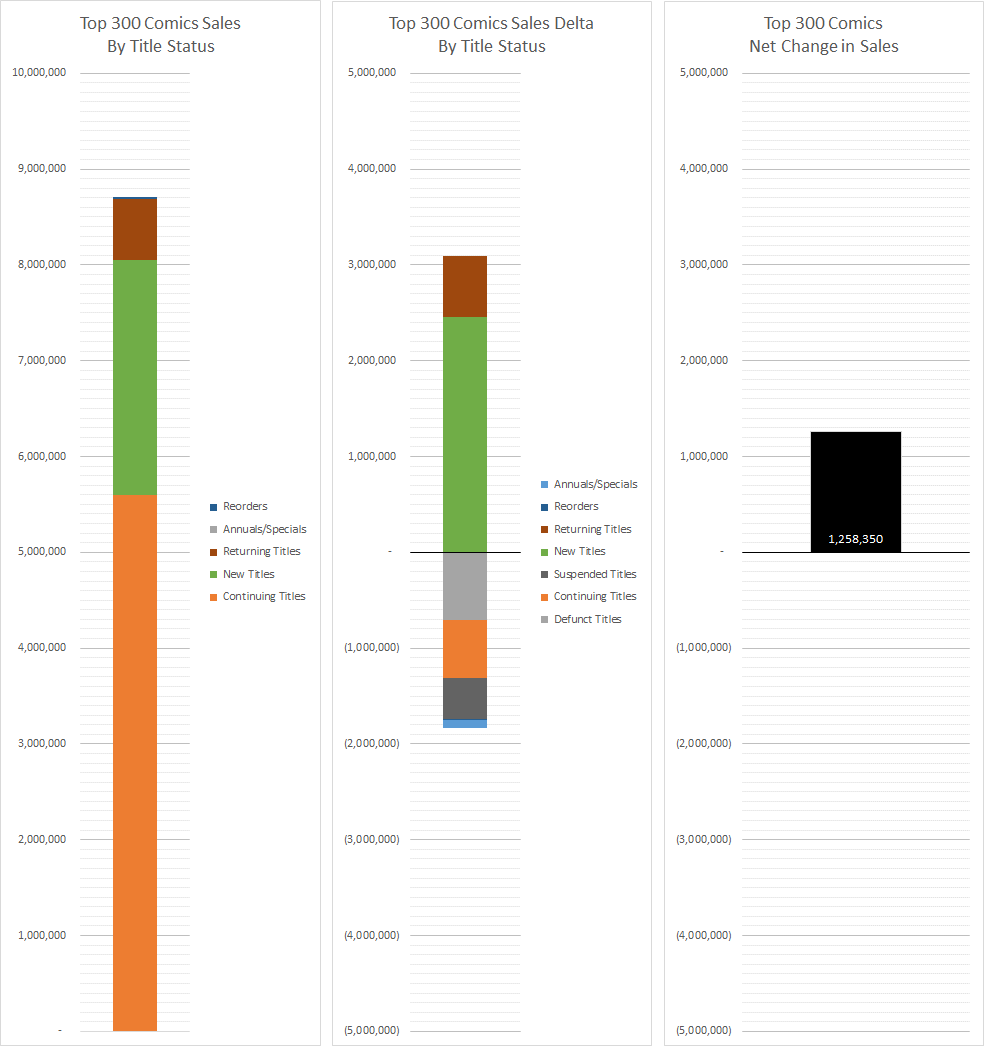
We can stack the units for each category and the month to month delta (change) for each category to get a picture of how the sales are for the month and how they changed from the previous month.
As we can see for the stacked bar chart on the left, starting at the bottom of the chart, nearly two thirds (63.63%) of the top 300 comics sales in October came from Continuing Titles. New Titles accounted for over a quarter (27.89%) of the sales. Returning Titles represented only 7.32% of the list. Almost imperceptibly at the top of the chart with less than a percent (0.92%) were Annuals/Specials and less than a quarter of a percent (0.23%) of the units were Reorders.
The stacked bar chart of the right is the net change in sales by category. Starting at the top of the chart, Returning Titles accounted for an increase in sales of 644,033 units over the total of the top 300 comics for September 2016. New Titles represented an increase in sales of 2,452,716 units. Note that at this point we hit the axis representing the zero point. Everything above is an increase in sales over the previous month while everything below is a decrease in sales. If the portion of the bar below the axis is larger than the portion above then sales went down. Fortunately, in October 2016, the portion above the axis (New Titles and Returning Titles) is larger than the portion below (Defunct Titles, Continuing Titles, Suspended Titles, Annuals/Specials and Reorders).
As we continue down the chart, we see Defunct titles represent 706,435 units permanently removed from the charts. Again, the future is uncertain and we've seen long dormant titles return. Continuing Titles had a net loss of 601,575 units. Suspended Titles represent 433,218 units which were on the list in September, not on the list in October but are expected to return at some point in the future. These units are loss, just missing in October. There were 91,402 units fewer sales of Annuals/Specials in October both because of lower average sales and not as many of these sorts of items. Reorders were down 5,769 units, almost invisibly on the chart, because of one less reorder item in October than in September.
The end result is a net change in sales of 1,258,350 units more than September 2016.
On the following charts, if the bars start on the right and go to the left, they represent a decrease in month to month sales. If the bars start on the left and go to the right, they represent an increase in sales.
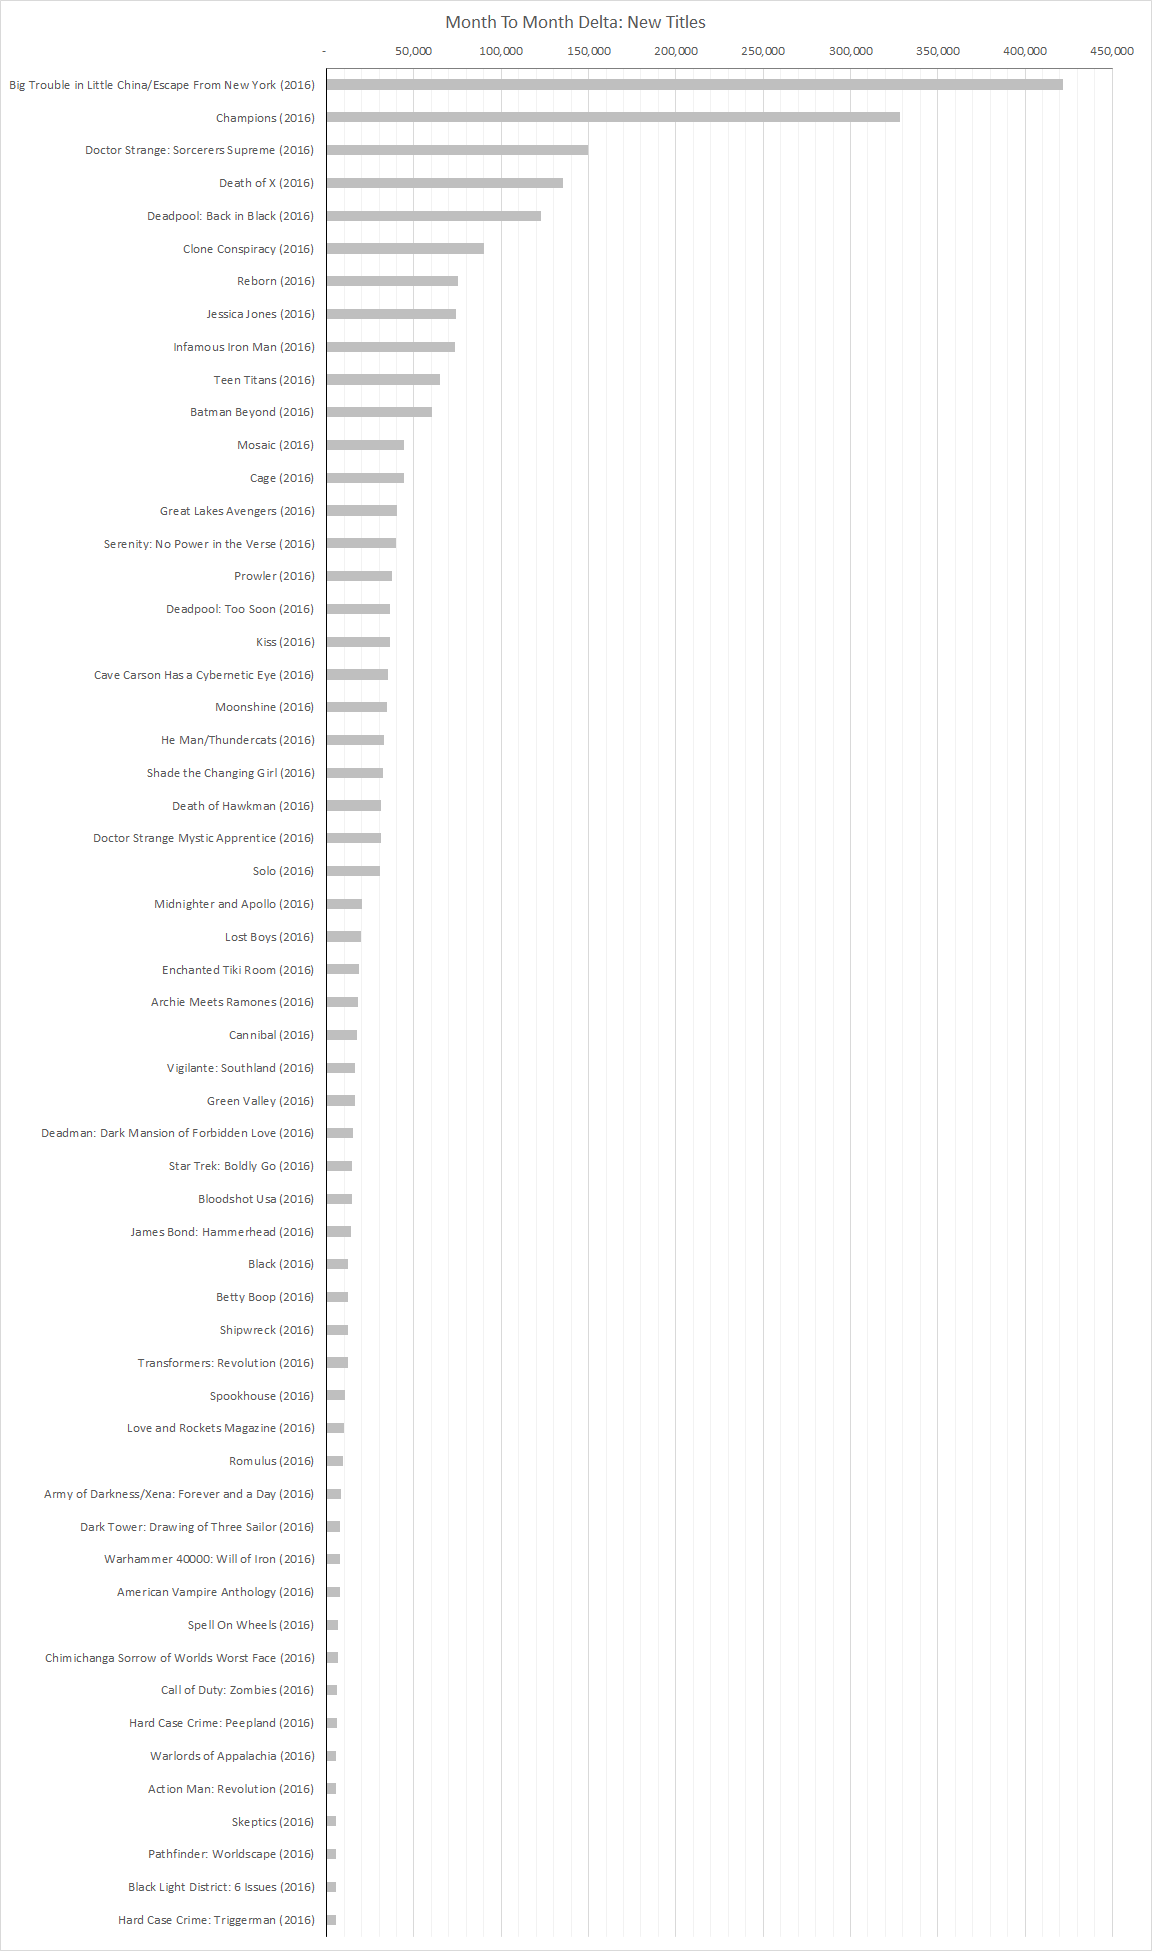
This chart represents units added to the top 300 comics total between September and October due to new titles being launched.
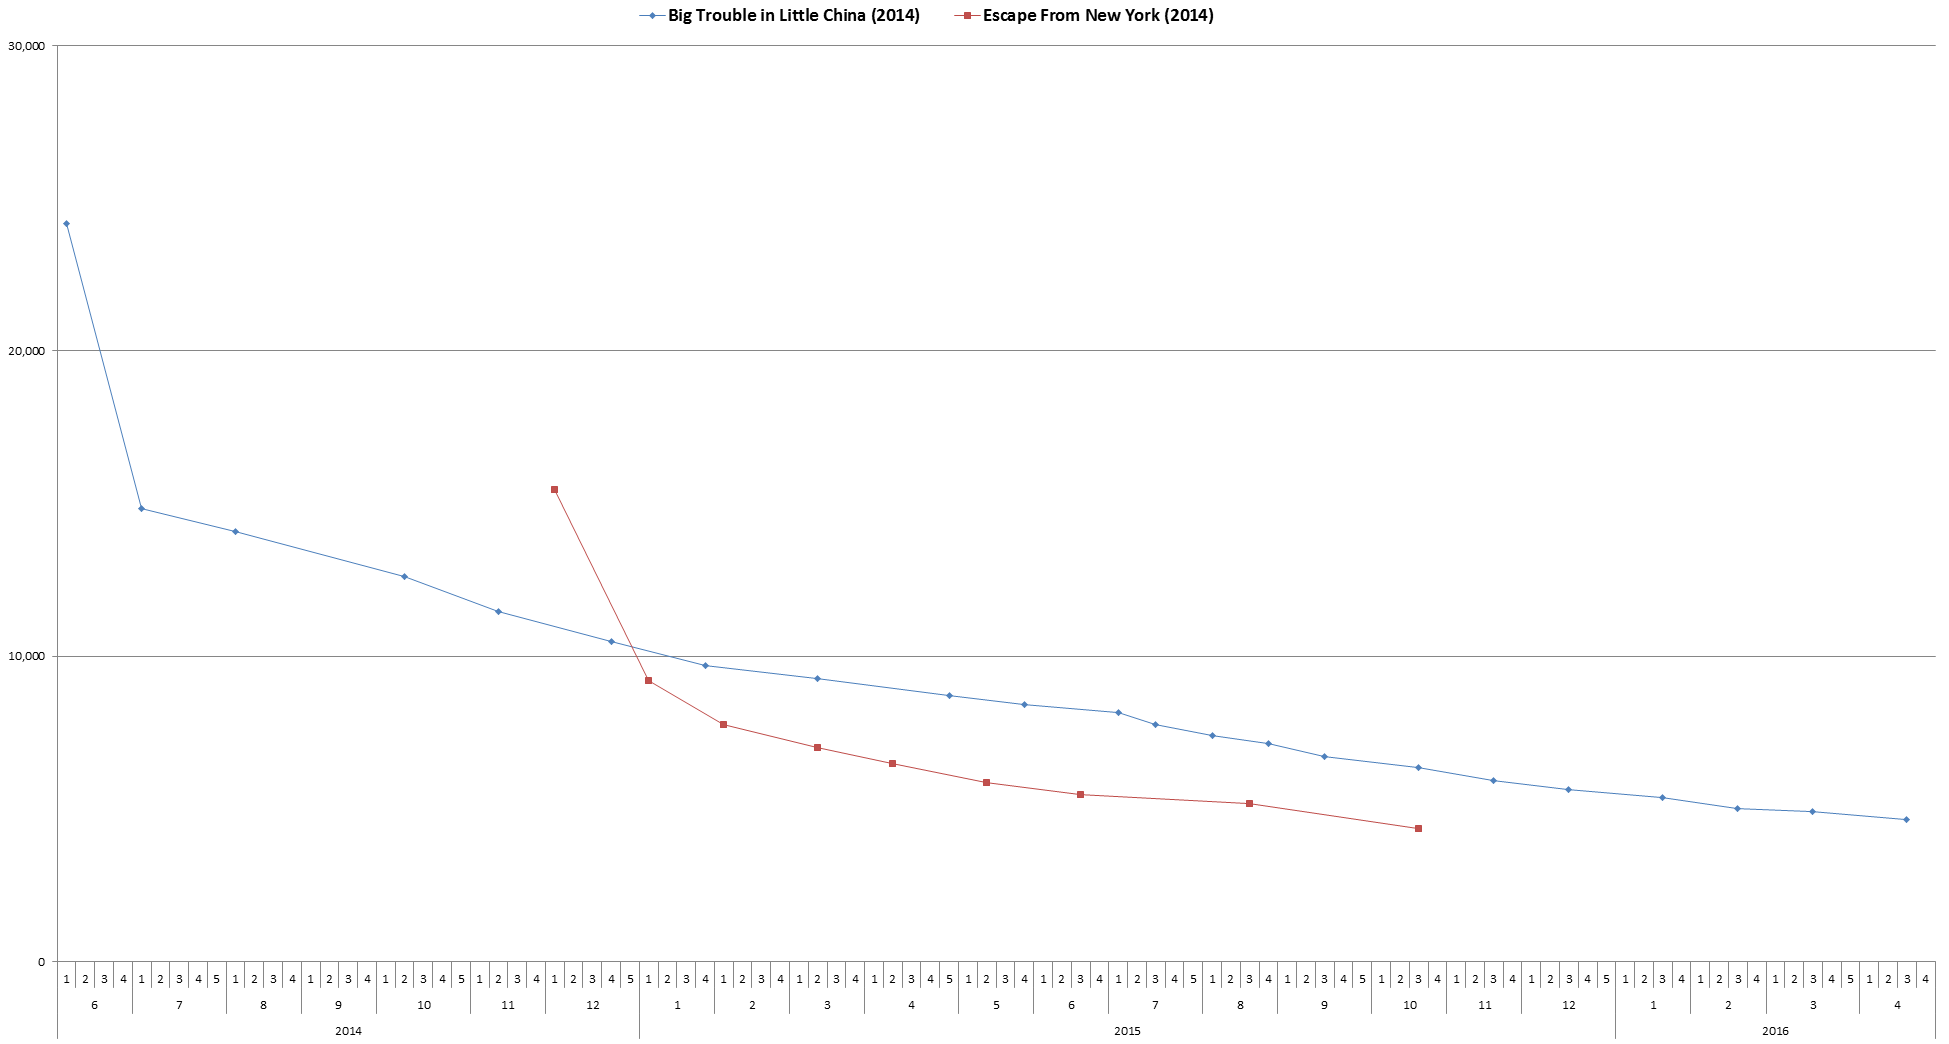
A large part of BOOM! Studios success in October was because of the 412,625 units for "Big Trouble in Little China/Escape From New York" #1 which topped the chart by nearly 100,000 units over the next best-selling item. For comparison, "Big Trouble in Little China" sold between 24,160 and 4,654 units and "Escape from New York" sold between 15,449 and 4,358 units. Both titles have done fine for BOOM! Studios but neither property has done remote close to this level of sales. It shouldn't come as a surprise that the second issue almost certainly won't sell anywhere near as well. A 90% drop is entirely possible and probable.
"Big Trouble in Little China/Escape From New York" #1 had two "main" covers, a subscription cover and an East variant and a West variant. The two main covers had a 50/50 intermix on one order code while the subscription cover was available via another order code. The East and West variant covers each required ten other copies to be ordered and were accessible to retailers on the east and west side of the country. To unlock the variant for the other side of the country, the retailer had to order 25 or more copies of the variant for their side of the country. Retailers could get a copy of the Barrett variant free for every 25 copies purchased. This was one of the more complex variant cover scheme but it topped the list so it must have worked. Given the exceedingly high sales level, I wouldn't be the least bit surprised if copies of it show up in subscription boxes.
"Champions" #1 was the first ongoing title launched by Marvel in a few months. In addition to the regular cover there was a 1-in-50 variant, a 1-in-100 variant and six different covers which could be ordered by retailers with orders of the regular cover of "Champions" #1 exceeding twice their orders of "All New, All Different Avengers" #9 which sold a total of 52,296 units in May 2016. This is another title which will drop significantly with the second issue. The sales of the first issue were inflated by the variant covers and are far above a sustainable sales level.
The first and second issues of "Death of X" and "Deadpool: Back in Black" shipping in October. The Month to Month Delta charts show the net changes caused by the title during the month and shows the total sales of each title during the month.
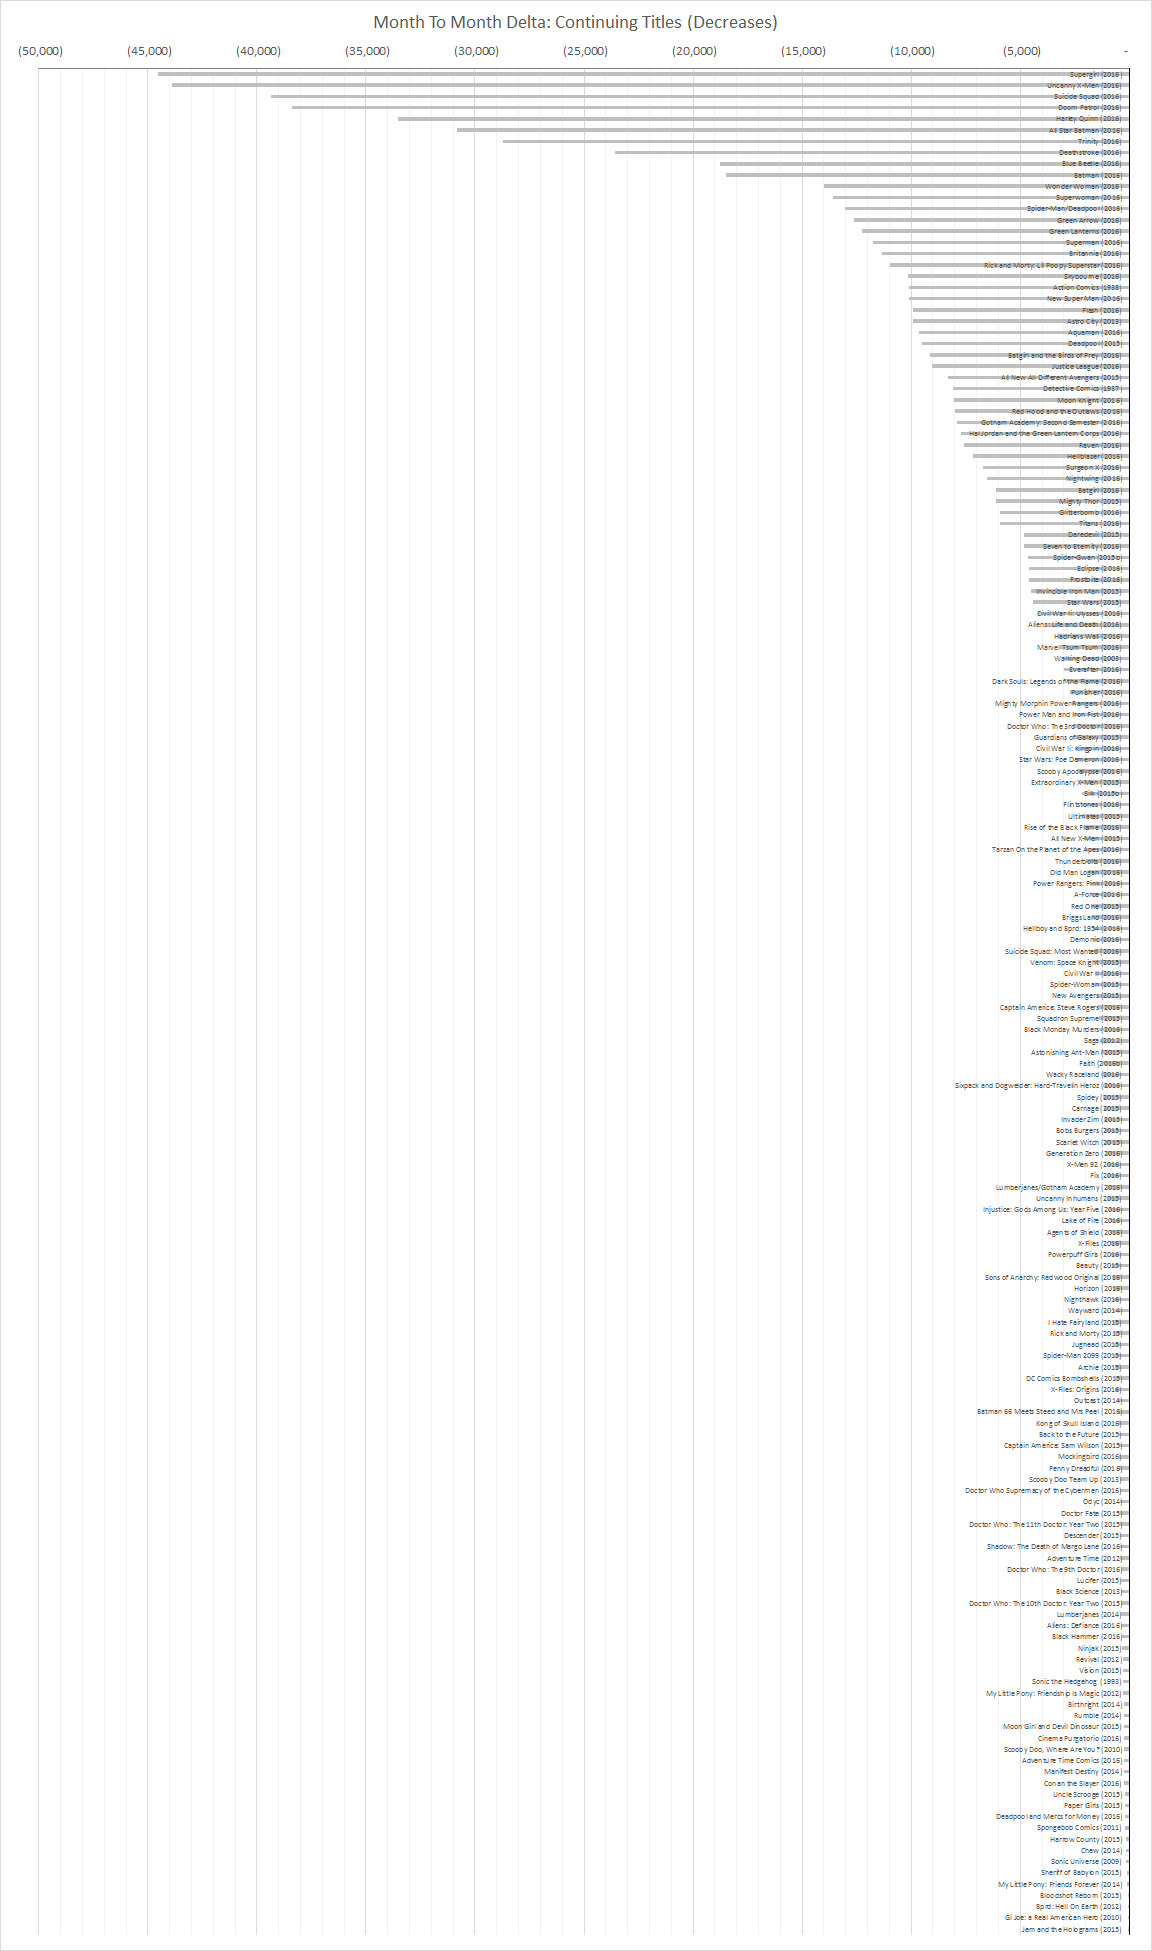
This chart represents 769,441 units removed from the top 300 comics total between September and October due to continuing titles dropping in sales. This is a crowded chart because most titles drop in sales from issue to issue. Again, there is nothing mandating this standard attrition. The month tot month drops for titles range from 44,555 units on "Supergirl" to a single unit drop for "Jem and the Holograms" which is as small of a drop as possible.
"Supergirl" #2 sold 45,691 units having dropped 49.37% from the first issue sales of 90,246 in September. "Supergirl" #1 had a alternate cover by Bengal and a blank alternate cover both of which could be freely ordered by retailers. The second issue had a alternate cover by Bengal which could be freely ordered by retailers. Both issues are 100% returnable. As we saw with the New 52 launch in 2011, retailers are ordering plenty of copies so reader can sample the titles and see which ones appeal to them. The fundamental difference between the incentive variant cover heavy approach by Marvel and the 100% returnable approach by DC is the amount of risk placed on the retailers. Marvel is placing a large potential risk on retailers which gamble on incentive variant covers while DC is taking on the burden of the risk with the 100% returnability.
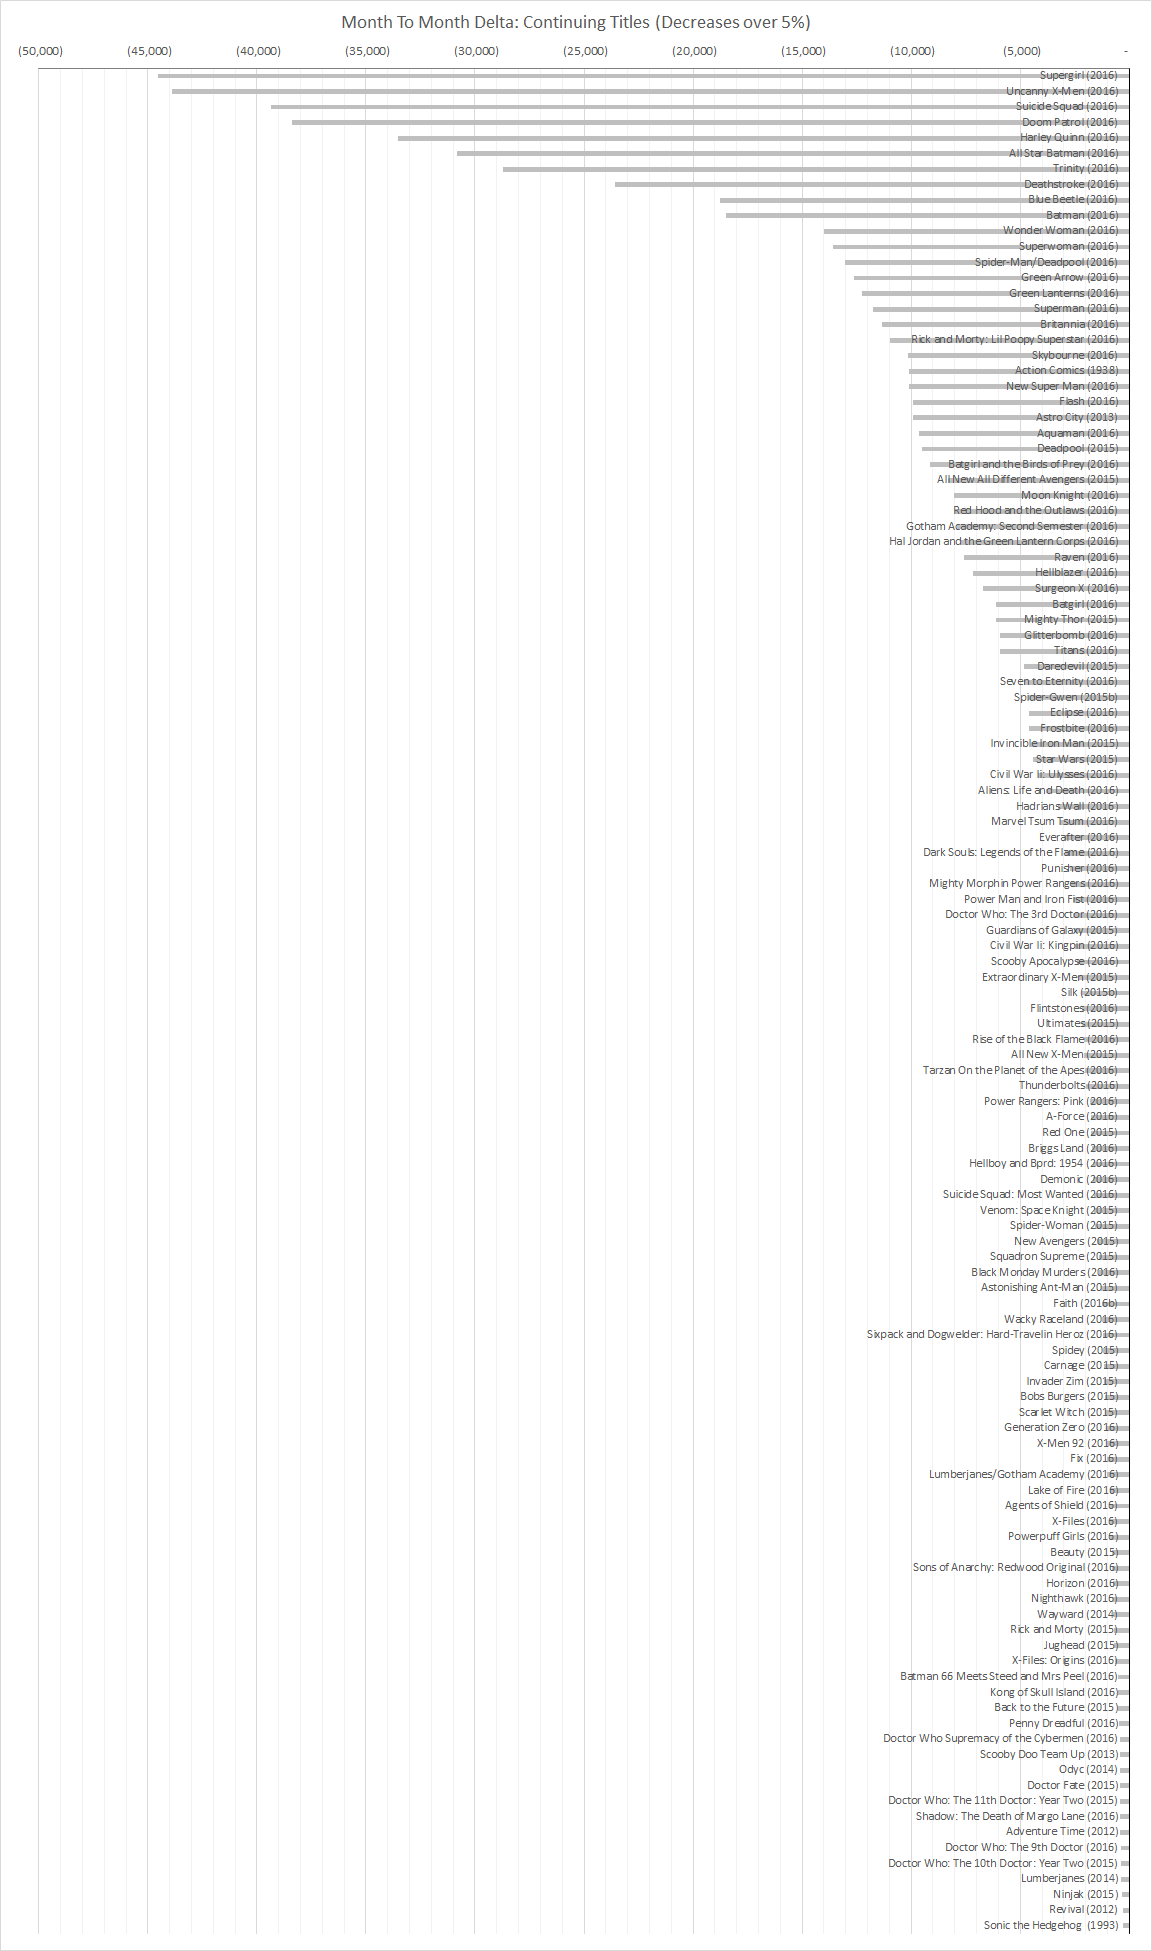
If we filter out titles which dropped less than 5% between September and October then we get a more readable chart representing a loss of 722,102 units:
Note both the 9,027 unit loss from "Justice League" and the 8,087 units loss from "Detective Comics" are removed from the list since they represent less than a 5% loss per title from month to month.
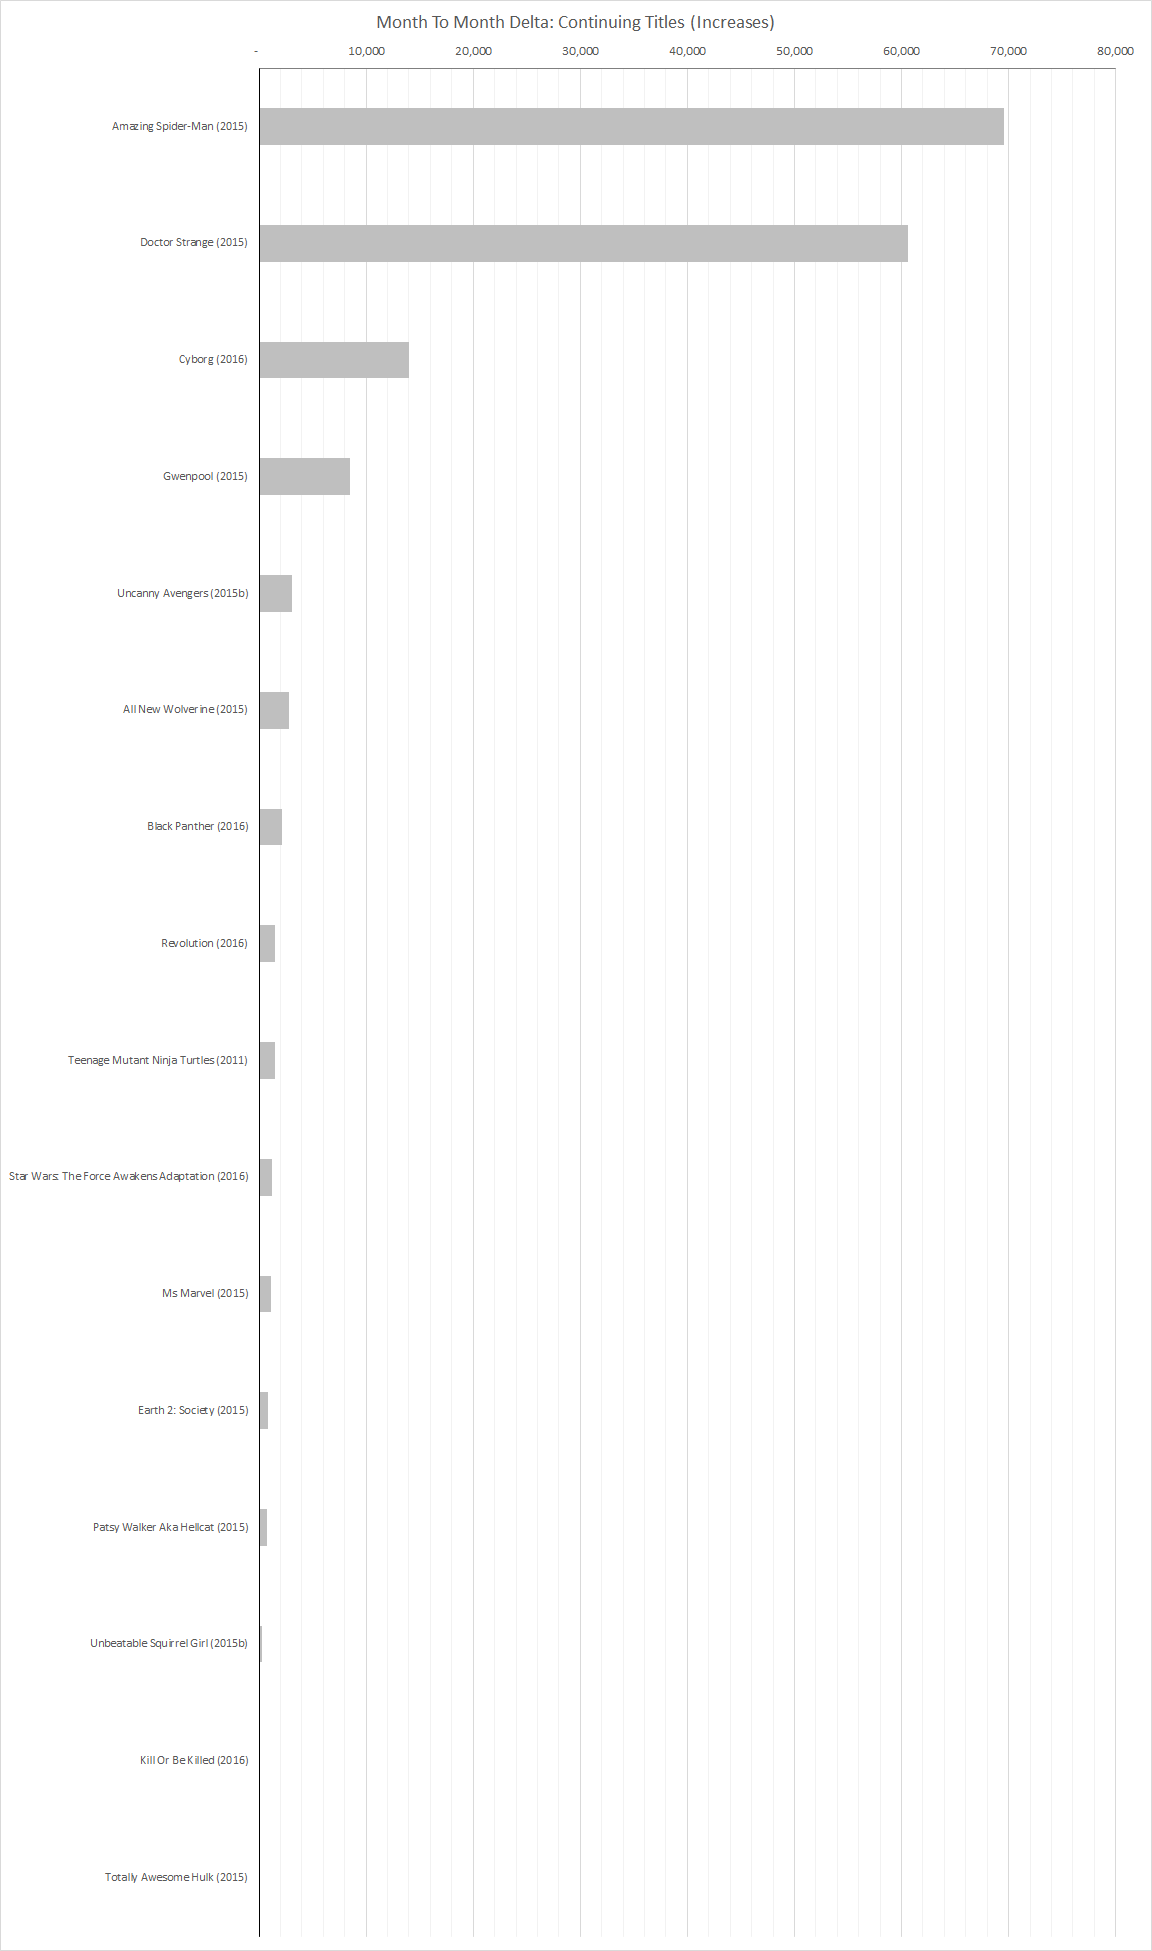
On the flip side, continuing titles which increase in sales from month to month are much more rare. Keep in mind these charts represent month to month changes ins sales on a per title basis, not an issue to issue increase in sales. For instance, "Cyborg" #2 sold 37,796 units, down 32.84% from the first issue released in September. "Cyborg" #3 sold 32,504 units, down another 14% from the second issue. Yet the title is on the list of continuing titles which increased in sales from month to month because two issues shipped in October versus the single issue in September. Currently I'm treating the Rebirth issues as one-shots titles and not as issues of the previous or subsequent volumes of the title they are transitioning between.
Other titles which shipped two issues in October but only one in September are "Amazing Spider-Man," "Doctor Strange" and "Revolution."
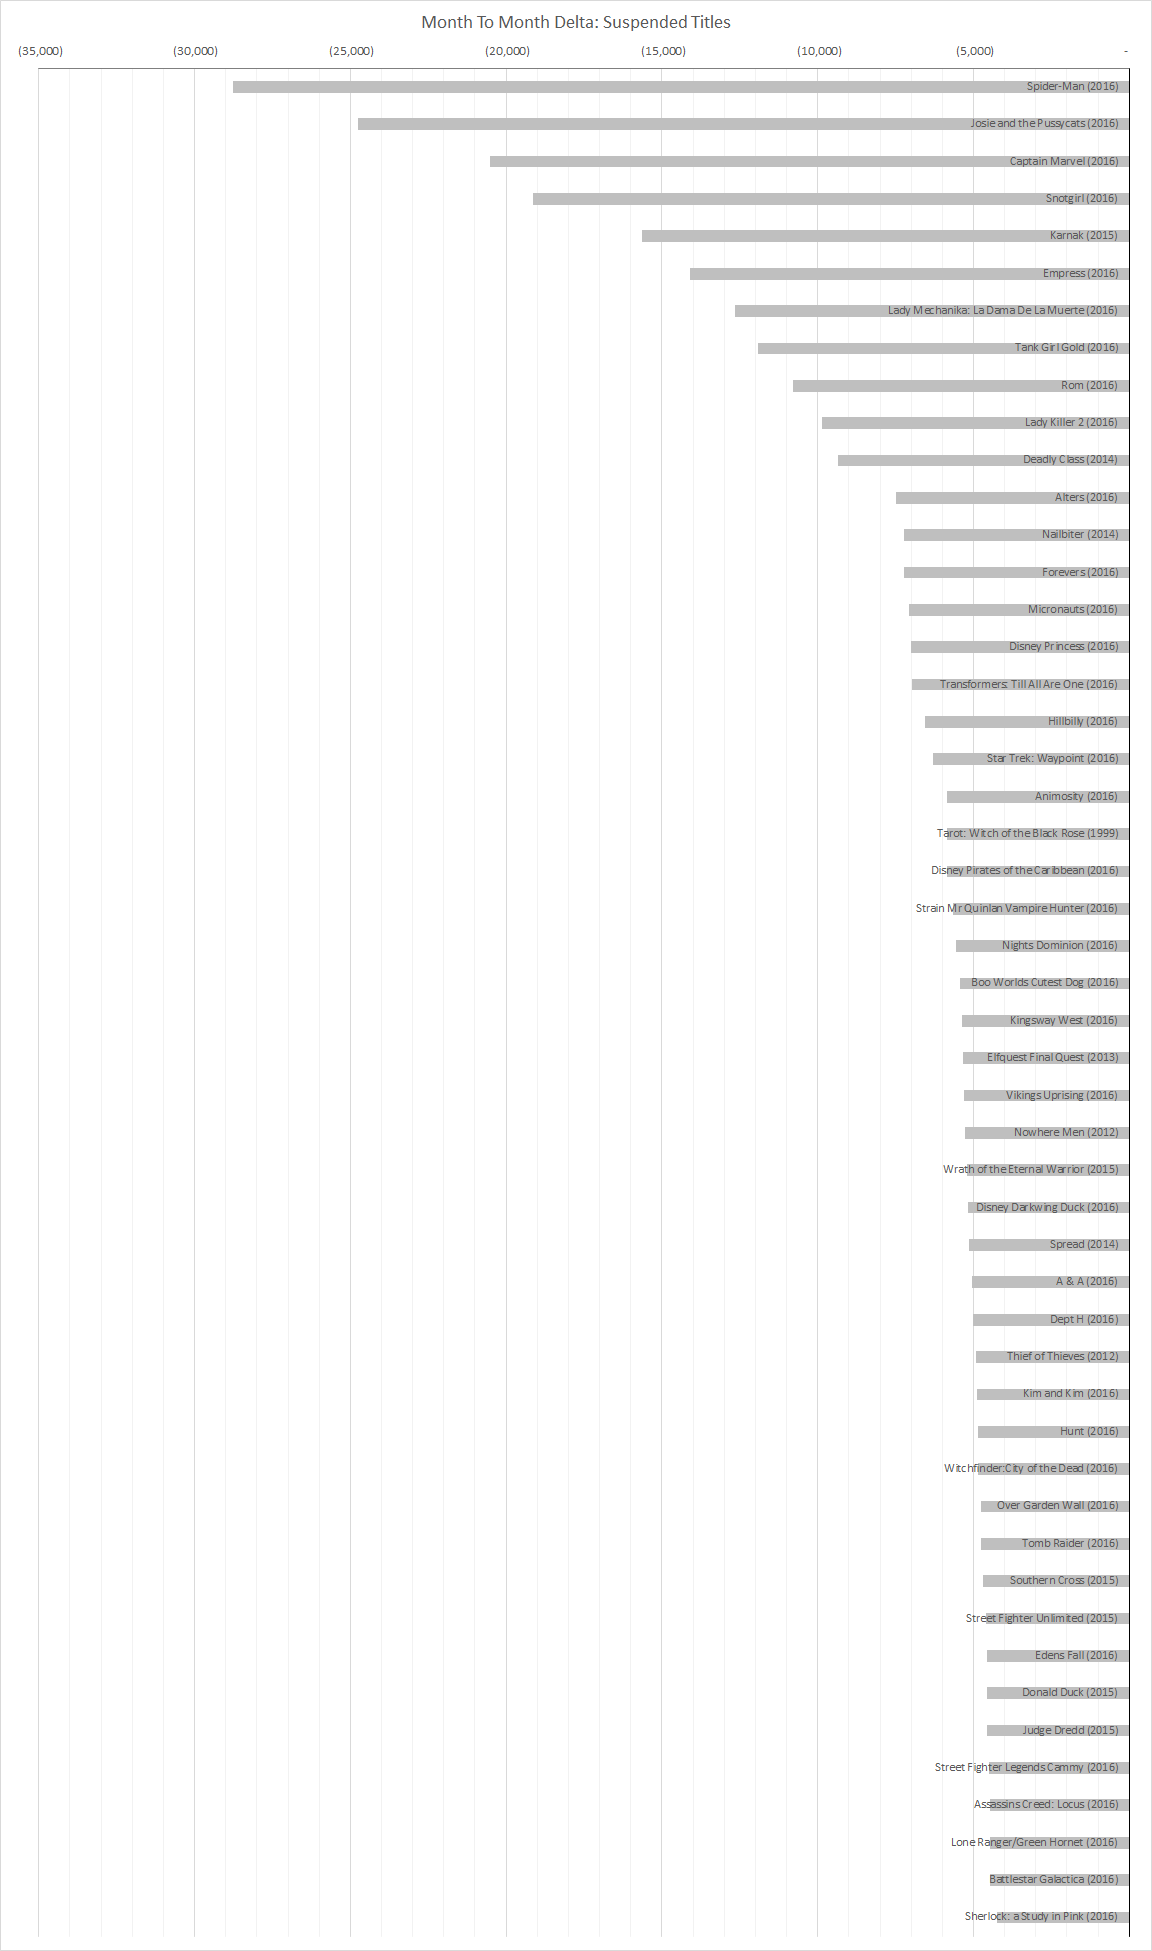
Over 50 titles on the list in September didn't ship in October such as "Spider-Man," "Josie and the Pussycats" and "Captain Marvel."
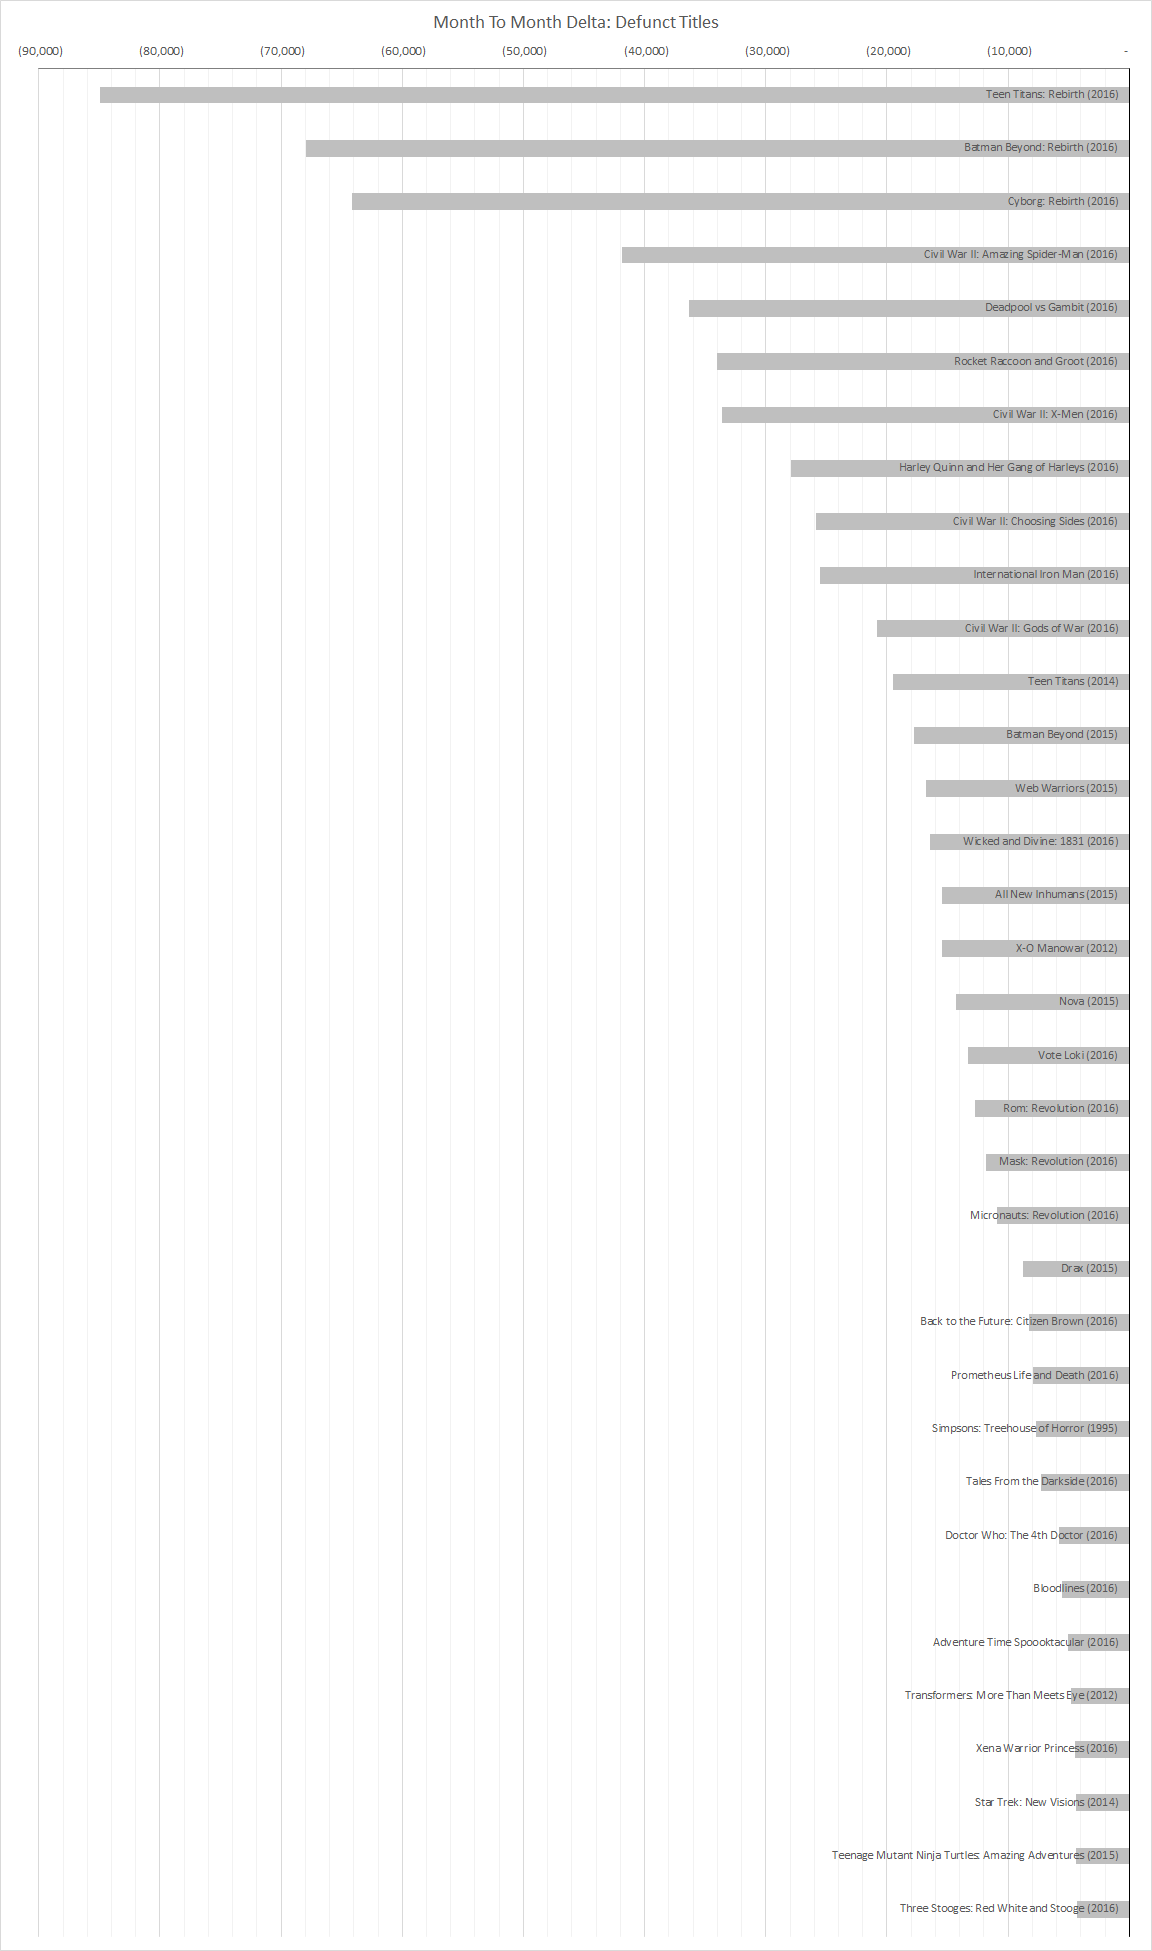
Nearly three dozen titles ended in September removing 706,435 units from the list. Topping this list are some Rebirth one-shots, a number of miniseries and some titles which will be replaced by new volumes such as "Teen Titans" and "Nova." One of the titles on the list, "Star Trek: New Visions," has at least one more issue planned but the series is currently being solicited as a series of one-shots which is why it landed on this list. Had it been solicited on a quarterly basis, it still might have ended up on this list depending on the timing of the solicitations. At this point, I only have the solicitation data up to and including the November 2016 Previews. Even with the solicitation information, it is surprisingly challenging to figure out when a series has ended versus just being between issues for a sometimes length period of time.
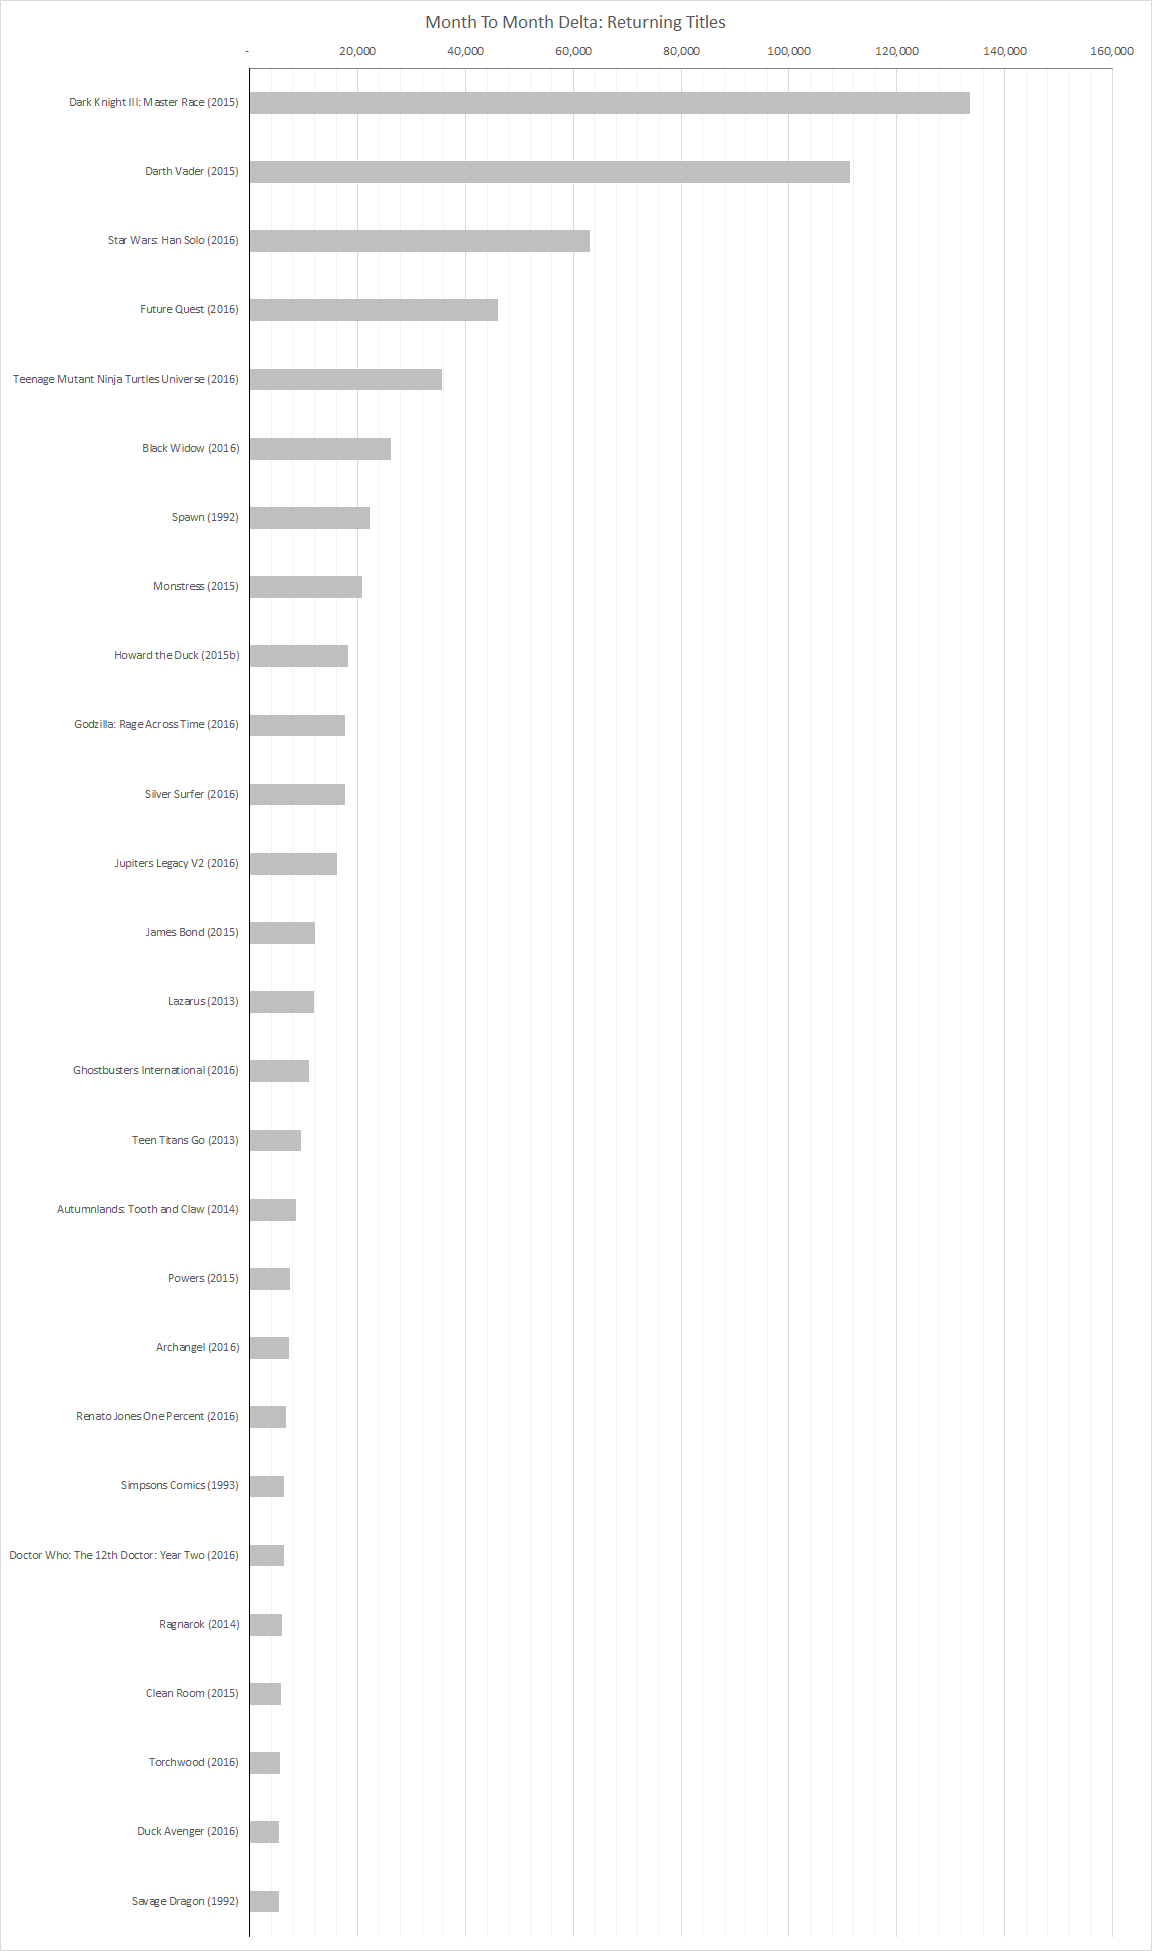
"Dark Knight III: The Master Race" #6 sold 133,642 units, down 15.65% from the previous issue which shipped at the end of August.
"Darth Vader" #25 sold 111,380 units up 47.72% over the previous issue. The title returns to the list in October after skipping over September because the previous issues shipped the last day of August. These returning units will go into the Defunct Titles category next month as this is the final issue of the series. There is a replacement series which should help Marvel recover the sales lost from this title ending.
"Savage Dragon" #217 placed 5,390 units on the list returning after having dropped below the radar of the top 300 comics list after "Savage Dragon" #200 sold 6,797 units in December 2014.
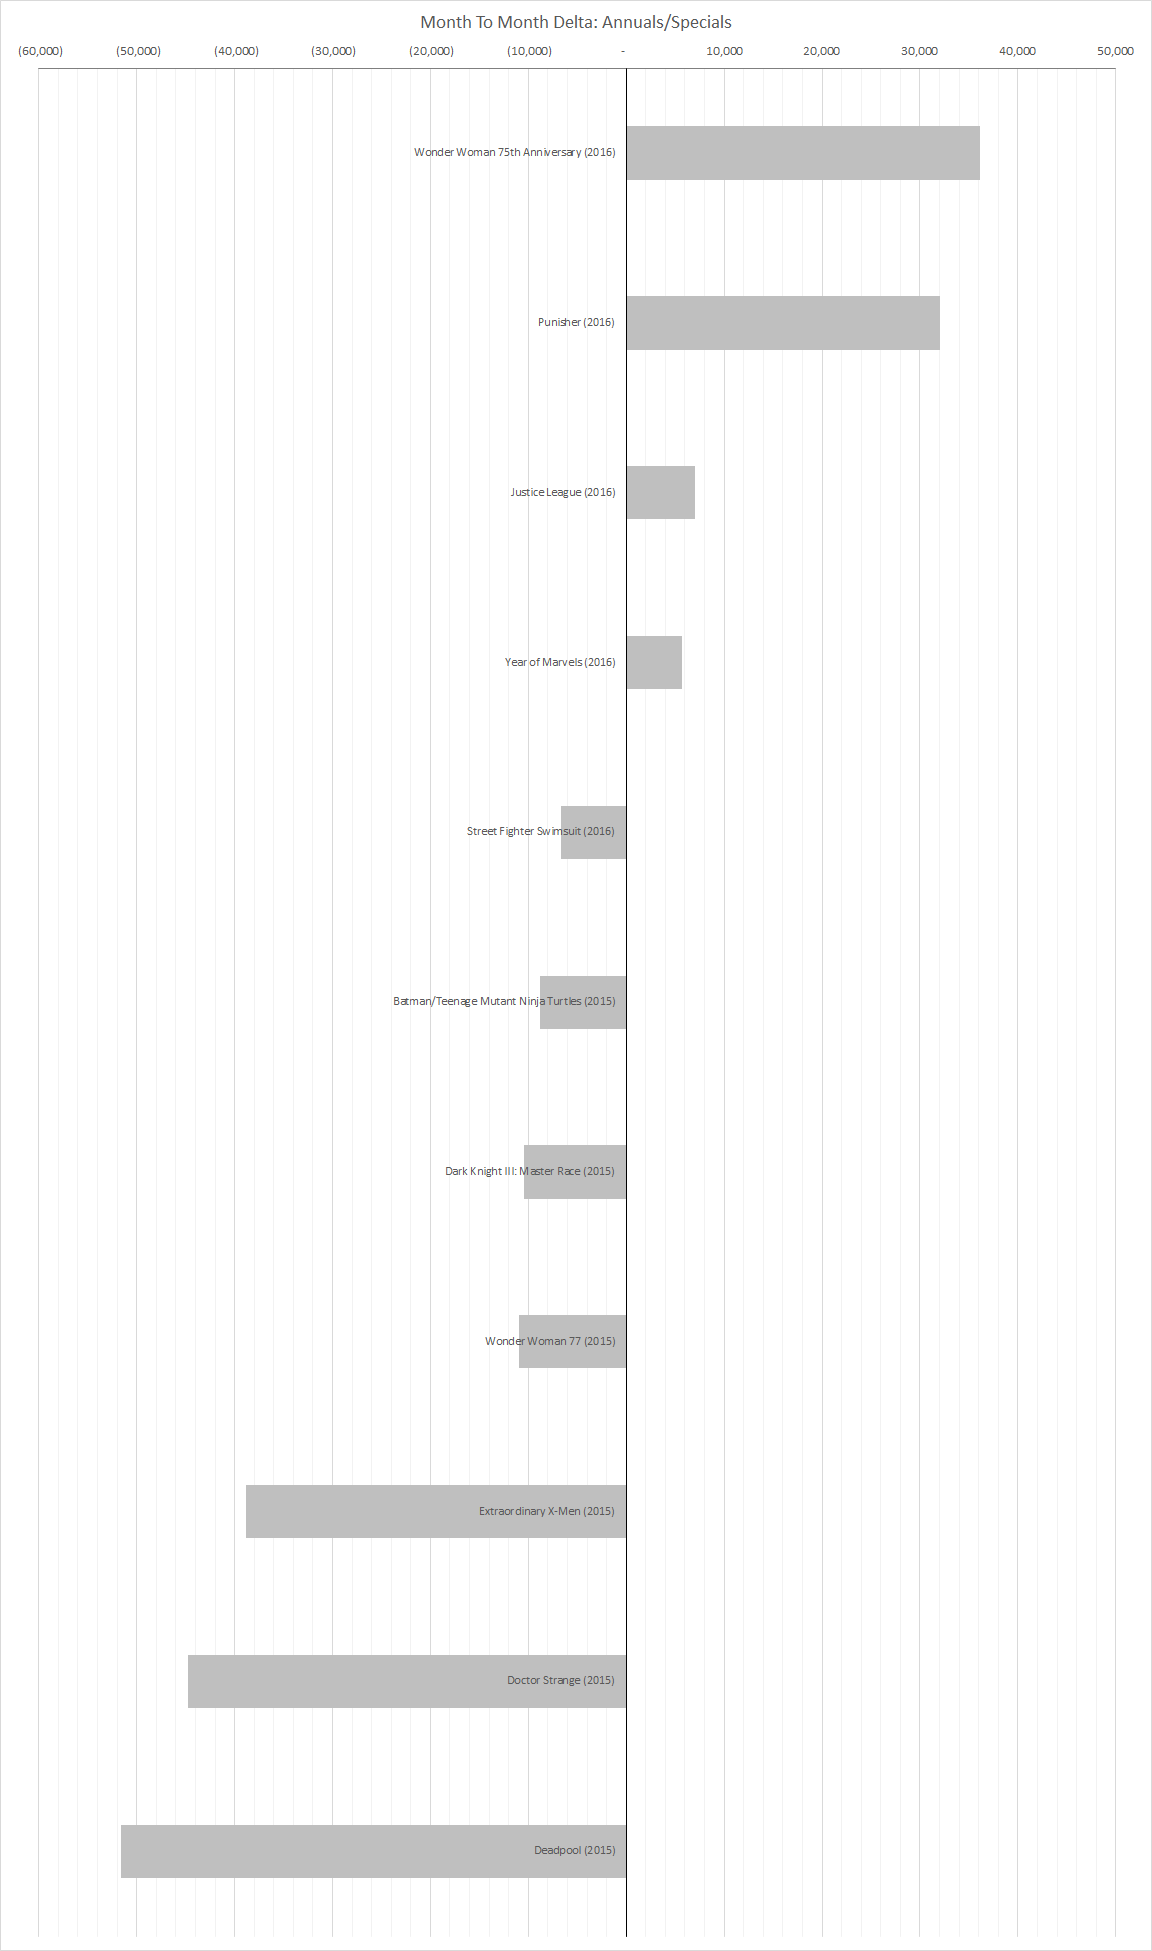
The Annuals/Specials category includes titles which shipped an Annual, Special, Director's Cut or other such issue either this month or last month. One shipping in the month increase the total of the top 300 comics for the month while ones shipping last month but not this month decrease the total of the top 300 comics. These are sales which aren't expected to continue from month to month. These are the best example of the "here today, gone tomorrow" transient sales.
One odd case in this group is the "Year of Marvels" series of one-shots which are effectively a bi-monthly anthology series with issue names instead of regular issue numbers. The title shows up as an increase in sales because of the bi-monthly frequency. There were no issues of the title last month to compare against. While a case could be made these units should be in the Suspended Titles and Returning Titles categories in alternating months, because I break the "Annual," "Special," etc into a title addendum in my database and use that same field for the "Amazing," "Incredible," "Unstoppable" and "Unbeatable" issue names for this series, the title shows up here. There is no great way to handle this sort of title shenanigans. The sales trend on the title is in line with how it probably would have done had they simply numbered the series normally.
Reorders generally don't account for a significant percents of the total units of the top 300 comics. What was surprising this in October was the 7,784 units for "Secret Wars" #6 which showed up on the list. Given the retail ranking of the item, it looks like there were offered at a larger than normal discount.
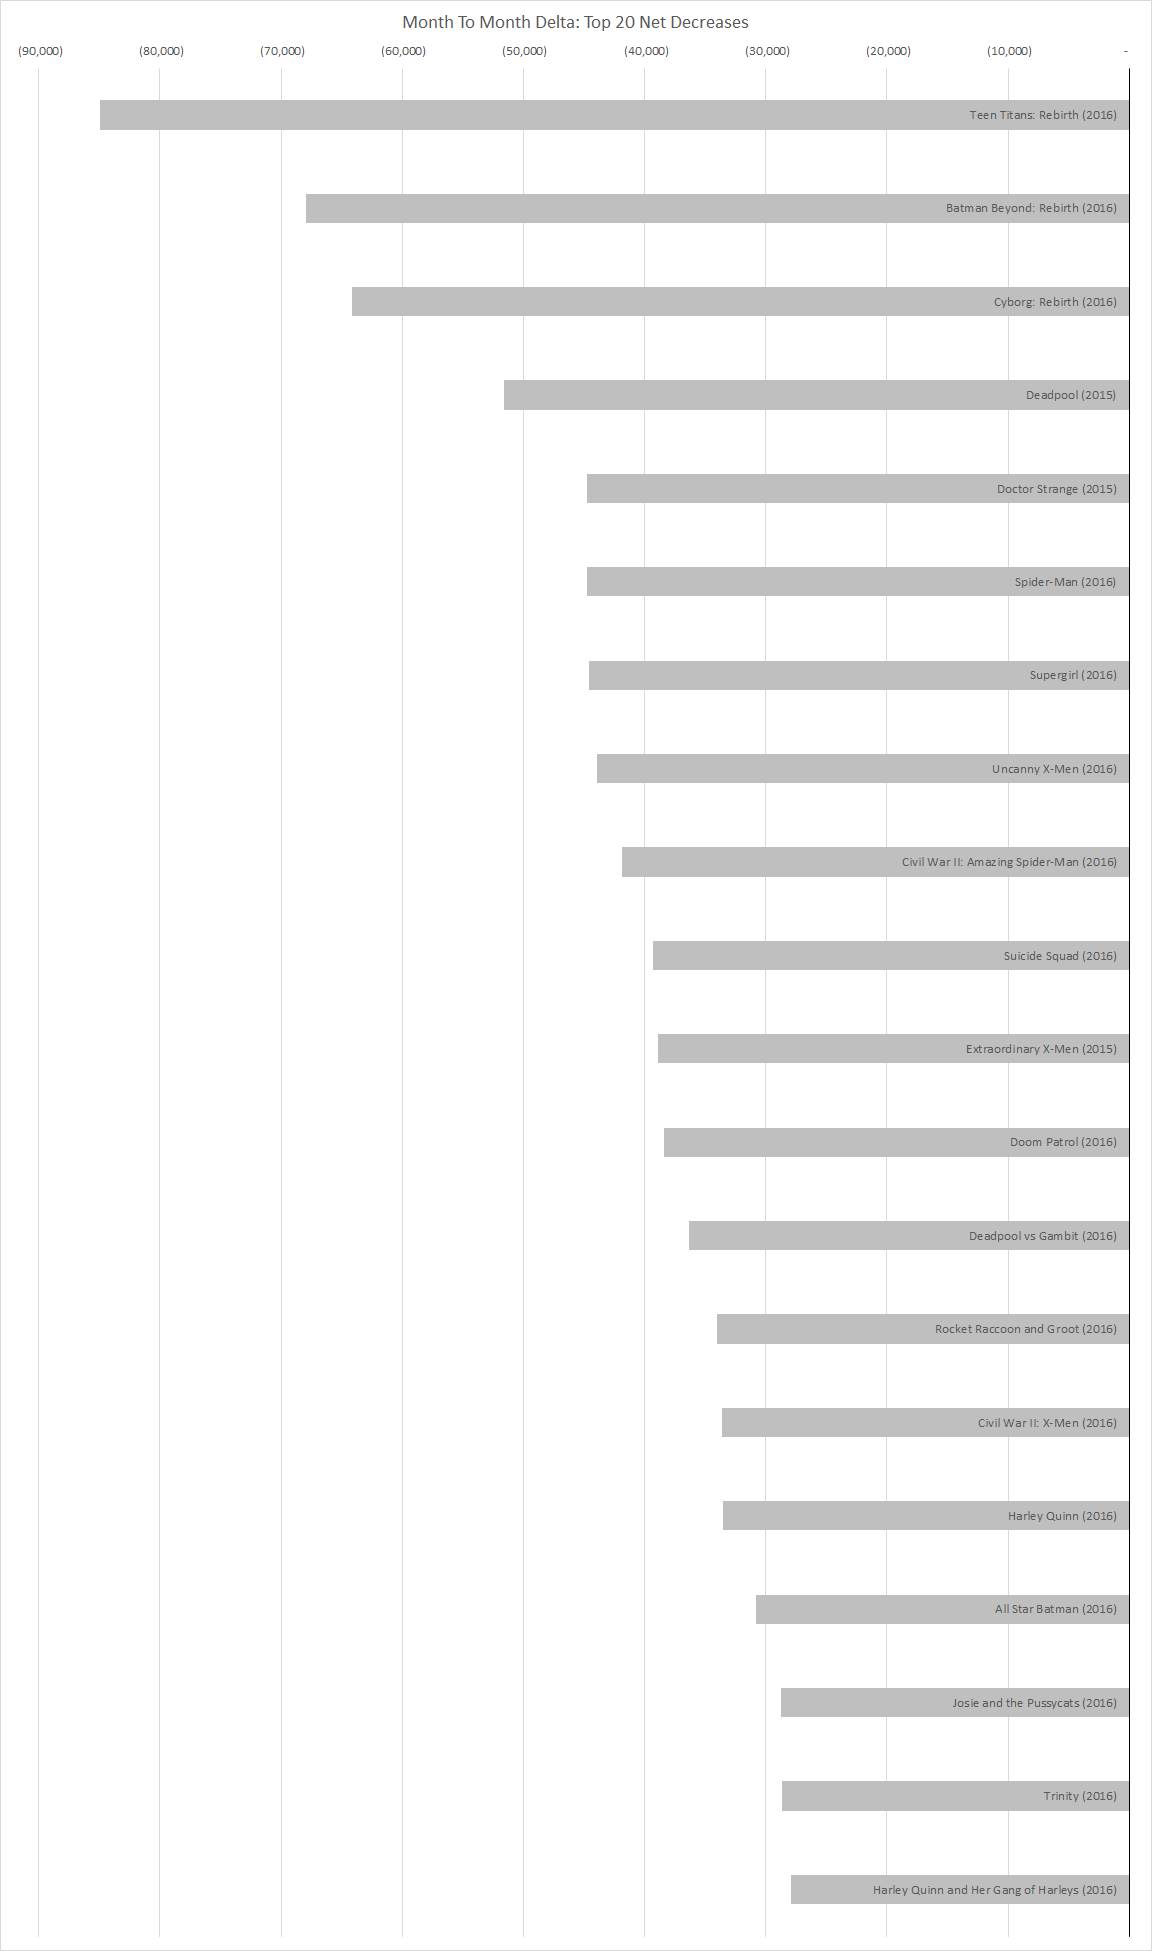
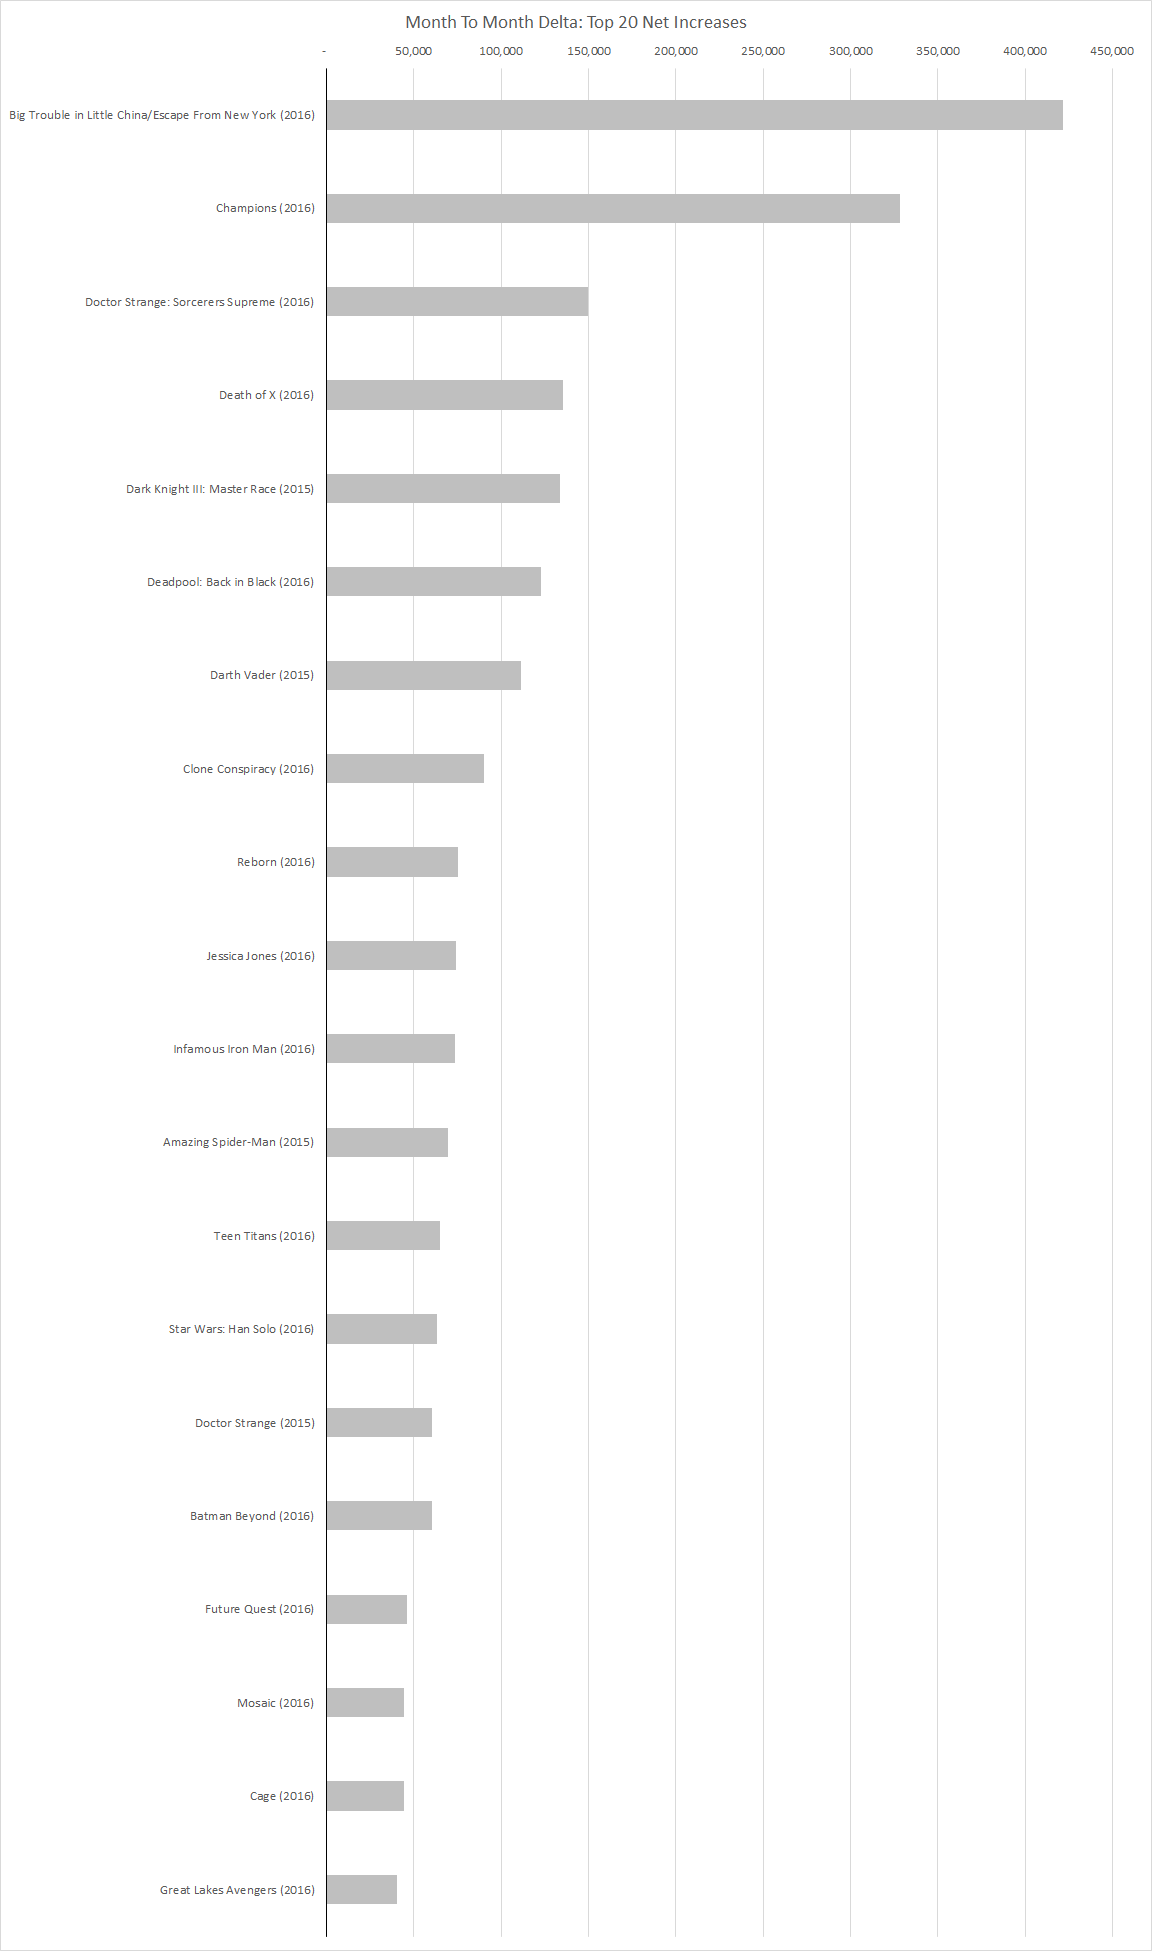
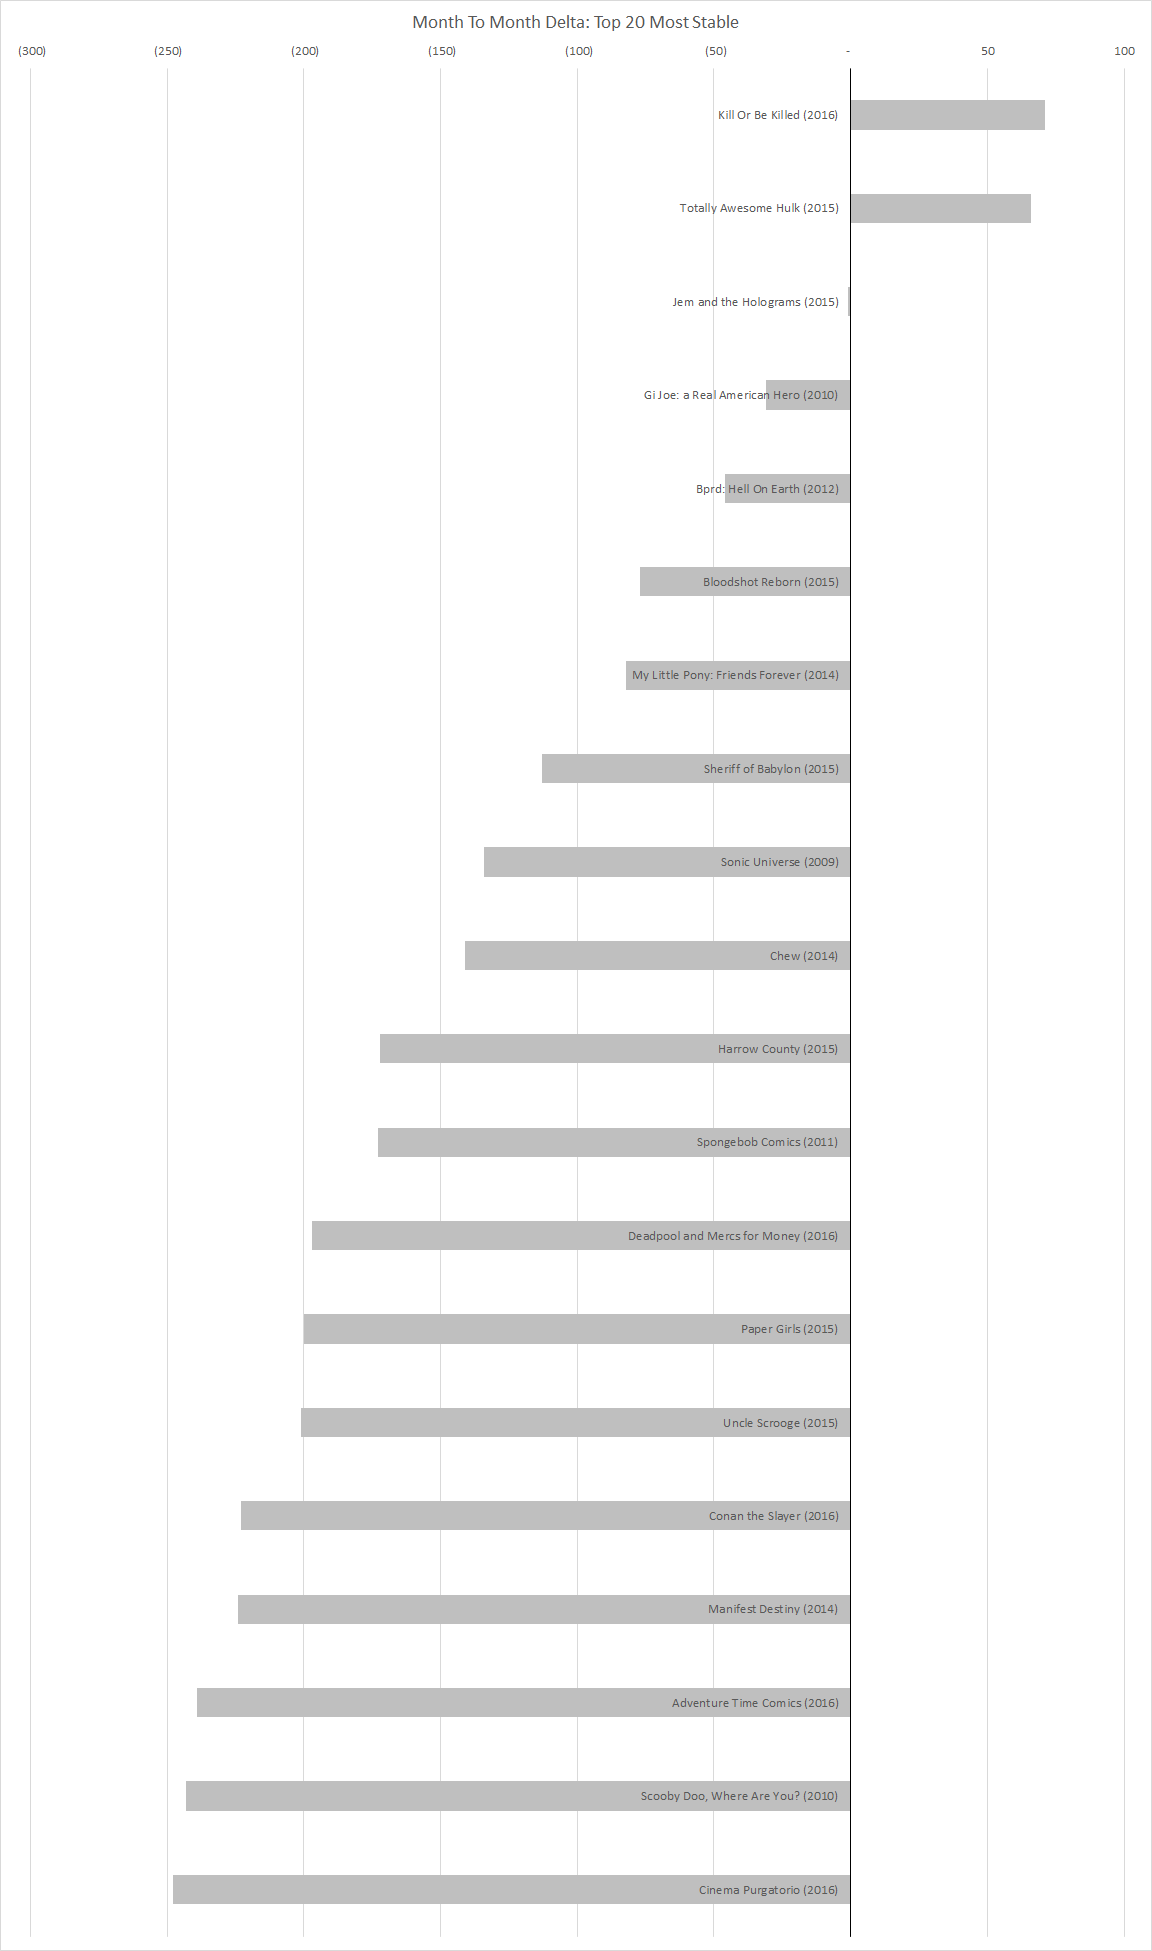
Having looked over all of the month to month sales changes, why don't we take a quick look at the top 20 net decreases, top 20 net increases and top 20 most stable titles:
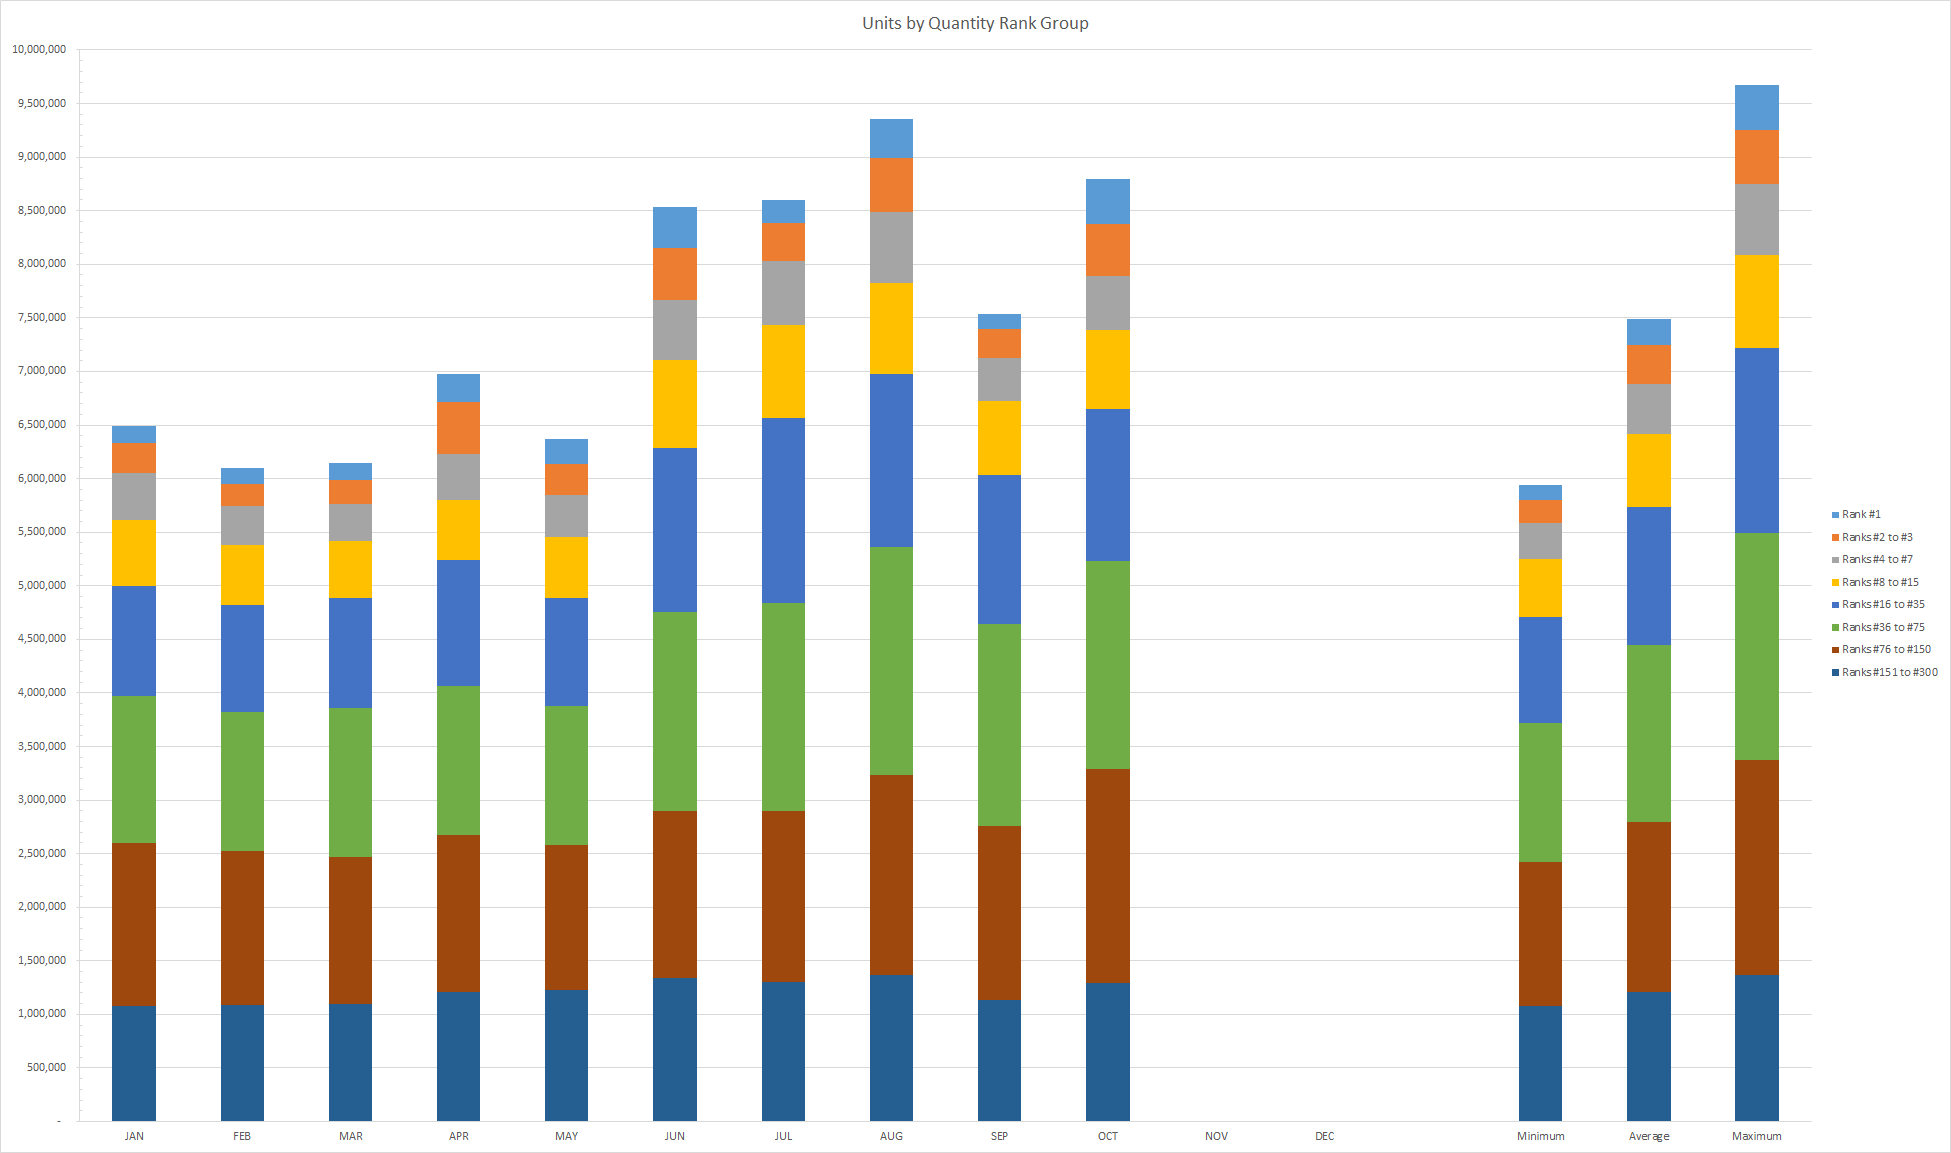
Finally, here is a look at how the month compares to the other months this year by quantity rank groups:
The top group is the best-selling item and each group after that is roughly twice the number of items as the previous group with the last group representing the bottom half of the top 300 comics list. The last three stacks are the lowest sales for each item, the average sales and the best sales for each group over the course of this year. As you can see, October 2016 was a strong month and the final quarter of 2016 seems to be off to a strong start

